Setting Google Ads Budgets Based on Pipeline Targets
Align Google Ads spending to actual sales pipeline, not form submissions.

Plenty of B2B accounts get built the same way a B2C account gets built: form fills as the goal, broad keywords doing the targeting, cost-per-lead as the scoreboard. That works fine for a consumer product where someone decides and buys in the same sitting. B2B doesn't work that way, and running it like it does is the first mistake worth naming.
A few things make B2B structurally different:
- Sales cycles run 60 to 180 days, not minutes.
- Clicks cost $5 to $50, not the $1 to $3 range common in consumer search.
- Multiple people sign off on a purchase. One lead is rarely the whole buying decision.
- The real measure of success is qualified pipeline, not how many forms got filled out.
Clicks got more expensive and conversion rates dropped at the same time. Anyone still budgeting off "leads at a target CPL" is measuring a shrinking, more expensive thing and calling it progress. Here's the part worth saying plainly: cost per lead is the wrong scoreboard. It rewards volume over quality and hides the only number that connects to revenue.
That number is pipeline per dollar spent. Not leads. Not CPL. How much pipeline does each dollar of spend create? That's the question the budget should answer, and it's the question most CPL-based reporting is built to avoid.
The reverse-funnel calculation: working backwards from revenue to budget
Run the math in reverse. Start at the revenue the campaign needs to produce, and work backward, stage by stage, until you land on a dollar figure to spend.
Step 1: Set the revenue target. How much closed-won revenue does the business need Google Ads to bring in?
Step 2: Work back to opportunities. Divide the revenue target by average deal size to get the number of deals needed. Then adjust for close rate. A common benchmark for opportunity-to-closed-won runs 20% to 30%.
Step 3: Work back to SQLs. SQL-to-opportunity typically runs 60% to 75%.
Step 4: Work back to leads. Lead-to-SQL typically runs 10% to 15%.
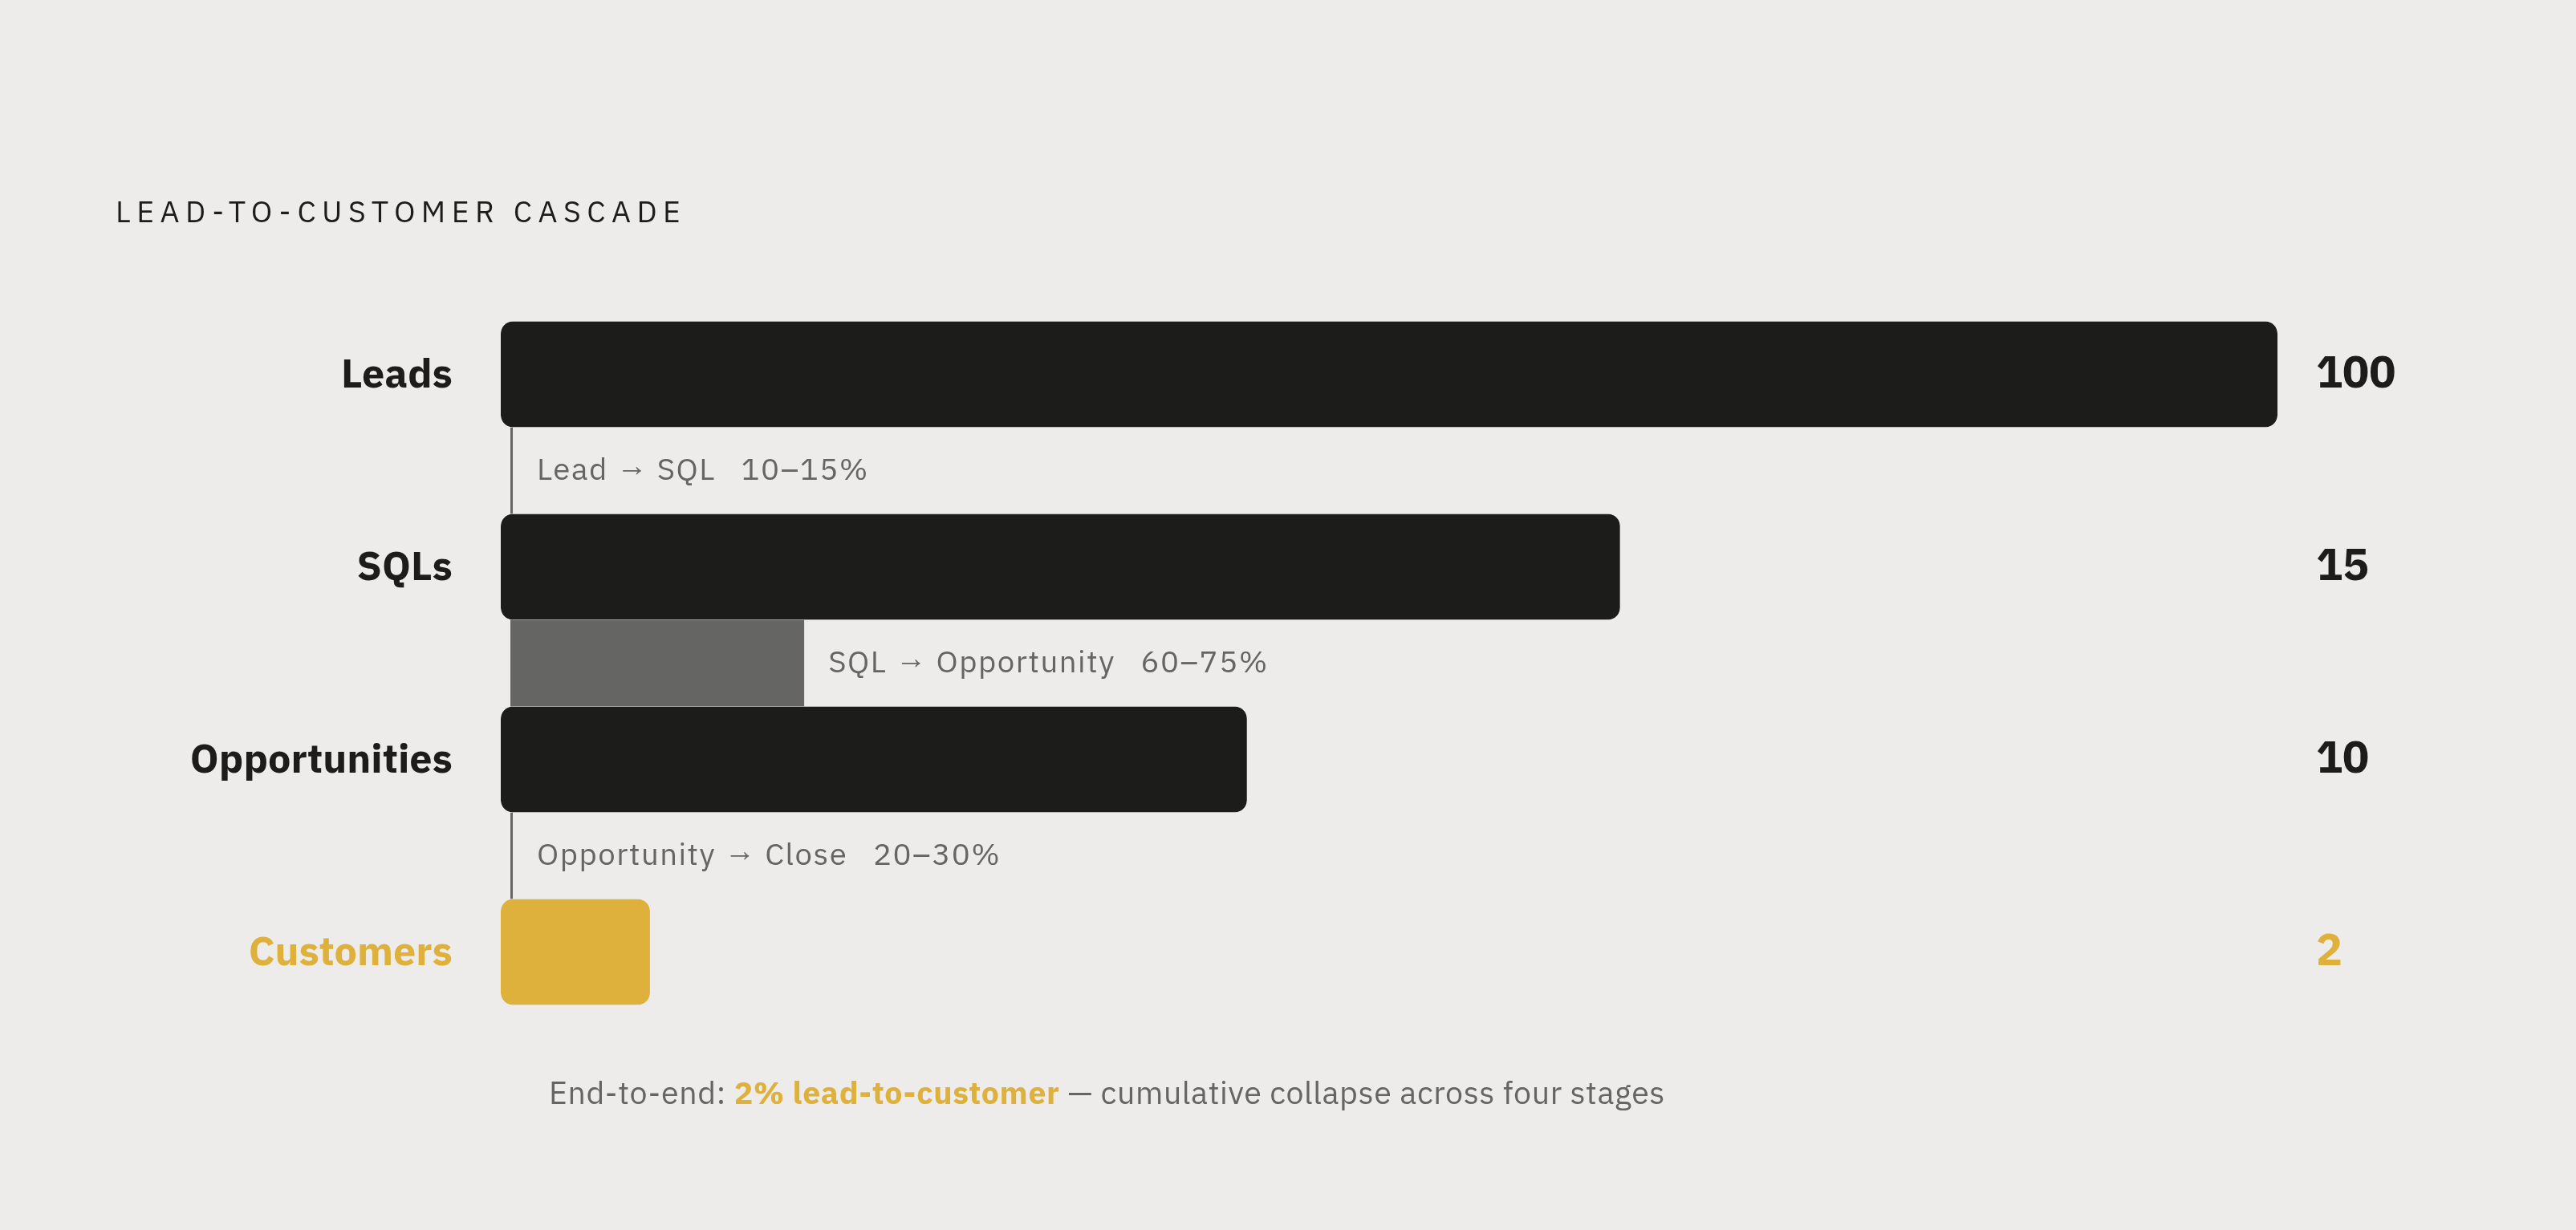
Here's how that cascade might look with round numbers: 100 leads produce 15 SQLs, which produce 10 opportunities, which close into 2 customers. That's a 2% lead-to-customer rate, start to finish. Multiply the number of leads needed by cost per lead, and there's the required budget.
Stop there, though, and the number still misleads. A $60 lead that converts to pipeline at 12% beats a $150 lead converting at 1%, even though a CPL table makes the $60 lead look merely "cheaper" instead of dramatically more efficient. Cost per lead was never the real answer. Cost per pipeline dollar is: total spend divided by pipeline created.
A workable target for that number is $0.10 to $0.20 per pipeline dollar, meaning pipeline should run 5 to 10 times spend over a 180-day window. Take a realistic cost-per-conversion figure as the input, run it through the funnel above, and see where the assumptions break. They usually break at the same two stages, which is exactly what the next section is about.
Where conversion rate assumptions go wrong and how to set them honestly
Benchmarks describe an average across many companies, not the specific program being run. Plug industry numbers into the formula without checking them, and the budget looks solid on a slide and falls apart against the real business.
Some guidance on which numbers to trust, and for how long:
- Lead-to-SQL (10%–15%): fine as a starting point. Swap in real CRM numbers once there's about 90 days of data.
- SQL-to-opportunity (60%–75%): swings a lot depending on how tight the ICP fit is and how the sales team actually sells.
- Opportunity-to-close (20%–30%): the widest range of the bunch, and the most sensitive to deal size and sales process.
- MQL-to-SQL (15%–21%): useful, but many sales teams have moved away from relying on this stage as a formal handoff gate.
That last point is the one most models get wrong, and it's worth taking a hard line on: if sales has stopped believing in MQLs, stop building a budget model around them. A lot of sales teams have moved on from MQLs entirely, straight to deal creation. Running the reverse-funnel calculation through an MQL gate that sales doesn't trust or enforce doesn't add rigor, it adds a conversion step made of fiction. That's a phantom stage sitting in the middle of the math, and it should get cut, not benchmarked.
Without conversion history of their own, teams should use the benchmark ranges, but build a sensitivity table alongside them. Show what the budget looks like if close rate lands at 20%, and what it looks like at 30%. The gap between those two numbers should be visible to whoever signs off on the spend, not smoothed away into a single confident-looking figure.
One more assumption tends to hide in plain sight: the formula usually assumes Google Ads leads convert at the same rate as inbound leads generally. They often fall short of that. That gap is worth measuring on its own, not folding into a shared average.
And check the top of the funnel too. Visitor-to-lead conversion on a landing page typically runs somewhere in the low single digits percentage-wise. Below that range, the problem isn't the ad spend, it's the page. More budget won't fix a landing page that isn't converting; it just makes the same broken page more expensive to run.
How campaign structure determines whether the budget can actually perform
Search in B2B is about capturing demand that already exists, not creating it from nothing. The person typing the query has already spotted a problem and started comparing solutions. That changes what the budget should be pointed at.
Keyword strategy follows from this directly: go after commercial and transactional terms that signal an active buying group, and stay away from broad informational terms that mostly attract researchers with no near-term plan to buy anything.
A reasonable split across campaign types:
- 60% Search — the core of demand capture.
- 20% Remarketing — needed because the sales cycle is long and one visit rarely closes anything.
- 20% Performance Max or Demand Gen.
Within that, a rough guide is to put about 40% of the total Google budget into non-brand search specifically, since that's where new demand actually gets captured rather than defended.
Negative keywords matter more than most bidding decisions, and they're the most underused lever in the account. One documented account built an 814-term negative keyword list and drove a 58x pipeline-to-spend ratio off it. Most accounts, by contrast, run with fewer than 50 negative keywords. Plenty run with zero. Most of the available upside in a B2B account sits unclaimed for exactly that reason: nobody bothered to build the list.
There's also a hard floor on how small a budget can go and still work. Google's automated bid strategies need somewhere between 30 and 100 conversions per campaign before they can optimize properly. Fund a campaign below that threshold, and the algorithm tends not to leave its learning phase. It just spins there indefinitely. That means the minimum viable budget isn't just about lead volume, it's about giving the bidding system enough signal to function at all.
Performance Max fits here too, with a warning attached. Point it at pipeline and revenue as the goal, and it can perform well. Leave it optimizing toward raw lead volume with no guardrails, and it will happily generate a pile of leads that go nowhere.
What changes when Google and LinkedIn budgets are planned together
Google and LinkedIn do different jobs. Google captures demand that already exists. LinkedIn builds demand among accounts that haven't started searching yet. Fund the two platforms as separate, isolated line items, and that division gets missed entirely. That's close to the actual mistake most B2B teams make: they treat Google and LinkedIn as competing for the same budget instead of doing two different jobs in sequence, then wonder why neither one moves the number on its own.
Here's why that matters for the math: if LinkedIn is putting a target account in front of the right people before they start searching, Google's conversion rates on those same accounts should climb once they do search. The two budgets aren't independent inputs. They interact.
A sensible sequence: start with demand capture, meaning Google Search plus retargeting. Add LinkedIn once there's budget and a validated ideal customer profile to point it at. Layer in brand and awareness campaigns once the program has room to scale.
LinkedIn's targeting depth is the case for including it at all. The platform reaches over 65 million business decision-makers, 10 million C-level executives, and 17 million people identified as opinion leaders, globally. That's a layer of professional targeting Google Search can't replicate on its own, because search only reaches people already typing a query.
On the budget mechanics: LinkedIn campaigns can technically run on $10 a day, but that's not a real number, it's a floor. Meaningful optimization needs more like $50 to $100 a day, and a realistic monthly testing budget lands around $3,000 to $5,000. On format, Thought Leader Ads drove 53% of conversions while using just 30% of LinkedIn spend, at a cost per conversion of around $70. That's a meaningful lever inside the LinkedIn allocation, not just a nice-to-have format choice.
The question worth answering isn't "what should Google's budget be" in isolation. It's how much pipeline the two channels need to produce together. Run the reverse-funnel calculation for the whole system, not for each channel as if the other doesn't exist.
How to pressure-test the budget number before committing to it
A number that comes out of a spreadsheet still needs to survive contact with reality. Five checks worth running before anyone signs off:
- Pipeline-to-spend ratio. At current conversion rates, does the budget land in the $0.10 to $0.20 cost-per-pipeline-dollar range? If it falls short, which assumption in the chain is off?
- Algorithm adequacy. Will the budget generate the 30 to 100 conversions per campaign that Google's bidding needs to optimize? If it falls short, the number is structurally too small no matter how clean the math looks.
- Sales cycle alignment. With a 60- to 180-day cycle, early results will look thin by design. Is the reporting window long enough to actually judge whether the budget is working, or is someone about to kill it in week three?
- Close-rate sensitivity. Run the formula at both ends of the 20% to 30% opportunity-to-close range. The gap in required budget between those two ends is real, and it should be a known range going into the conversation, not a single confident number.
- Landing page conversion. If visitor-to-lead is below the low single digits, the budget is quietly compensating for a page problem. Fix the page before adding more spend to paper over it.
A budget that survives this pressure test comes out as a range, not one clean figure, with the assumption behind each end spelled out, so whoever's approving it knows what has to be true for the number to hold up.
Handing the budget a system that can actually spend it well
The reverse-funnel math produces a defensible number. Whether that number keeps working depends on something the math doesn't cover: whether each month of campaign data leaves something useful behind for the next month to build on.
Here's the pattern that quietly wrecks a lot of B2B paid media programs: they restart from zero every quarter. New agency, new contractor, new person inheriting the account. The conversion rate assumptions in the formula rarely get sharper, because nothing is accumulating. Each new owner runs the same benchmark guesses the last one started with. That's the real overrated idea in this whole exercise: that getting the number right once is the hard part. Keeping it right is the actual work, and it's the part almost nobody budgets time for.
Turning a correct number into a number that keeps paying off takes a few things happening on an ongoing basis, not on a quarterly cadence:
- Watching conversion rates at every stage of the funnel continuously, not once a quarter.
- Figuring out whether a dip is a creative problem, a landing page problem, a keyword problem, or a bidding problem, rather than just reporting that cost per lead went up.
- Feeding real pipeline and revenue numbers back into the campaign so the bidding algorithm is chasing the right outcome, not a proxy for it.
- Attributing pipeline to campaigns closely enough that the conversion rate assumptions in the original formula can actually get updated with real numbers instead of benchmarks.
That raises a fair question for any sales-led B2B team: who's actually doing that ongoing work? Not who set the budget, but who's watching it week to week, diagnosing what's off, and adjusting.
One structural detail worth naming directly, not treating as a quirk: if whoever manages the account gets paid a percentage of ad spend, there's a built-in incentive to recommend spending more, since a bigger media budget means a bigger management fee. That's a conflict of interest sitting inside the standard agency pricing model. A flat management fee, decoupled from spend, removes most of that incentive. Under that model, the budget stays sized to what the pipeline math actually requires, rather than to what maximizes someone else's cut. The whole exercise starts with a revenue target and works backward to a number. The way the budget gets managed should pull in that same direction. Absent that alignment, the math was probably never really the plan.