Post-Click Experience Alignment Between Ads and Landing Pages
Misaligned landing pages waste half your paid budget before visitors even see your offer.
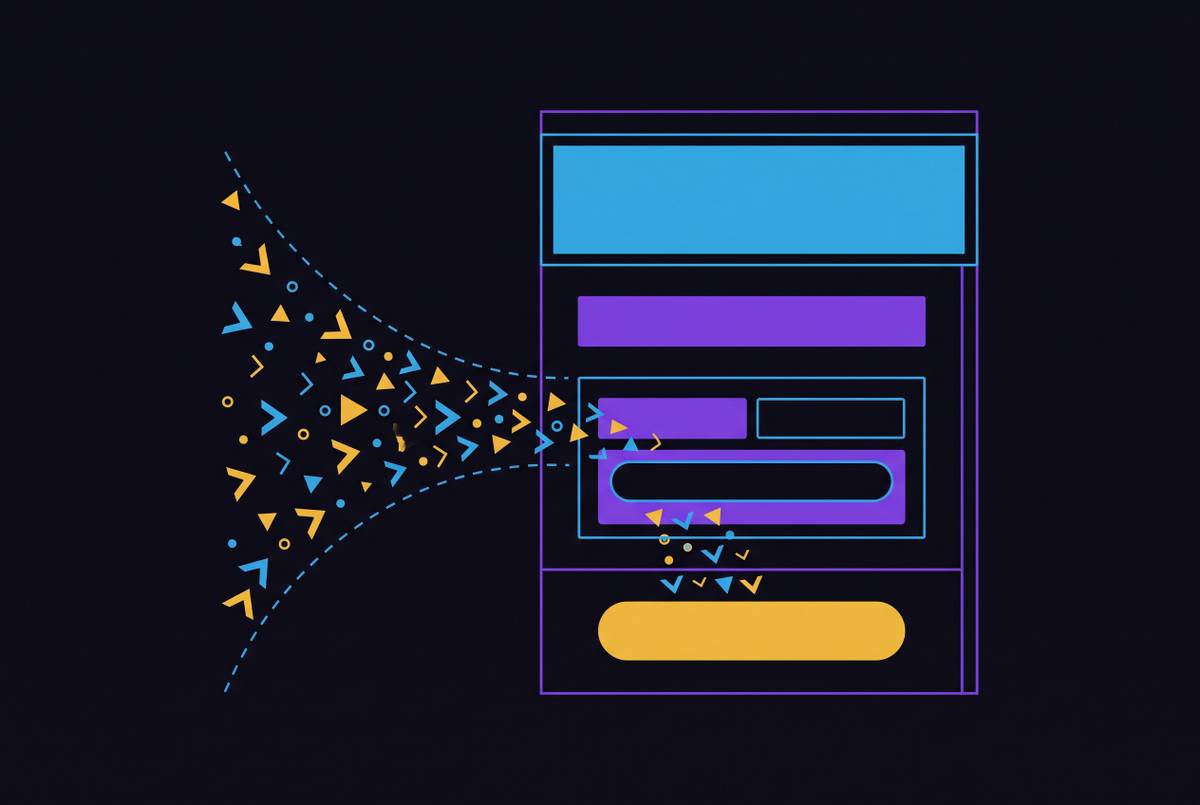
Picture the scene: someone searches for "B2B SEO services for SaaS companies," clicks the ad that promises exactly that, and lands on a homepage about "full-service digital marketing". The intent was narrow. The page is wide. Trust breaks in the first second, before the advertiser even gets a chance to make a case. That gap, the space between the click and whatever happens next, is where most paid budgets quietly leak out.
Most teams treat the click as the finish line. The click is the starting gun. It's the starting gun. A buyer who's ready to act wants to see their exact problem reflected back at them, and when they don't, they leave. One survey found that 68% of B2B buyers call irrelevant content, content that doesn't match their stage in the buying process, a major turn-off, and it's the reason they disengage. That's a hard requirement. That's most of the audience walking out the door.
Why does this keep happening, even at companies that obsess over ad performance? Part of it is structural. Ad optimization lives inside Google Ads or LinkedIn Campaign Manager, tools built to tweak bids, audiences, and creative. The landing page lives somewhere else entirely, on a separate platform with separate owners and separate reporting. Nobody's watching the seam between them, so the seam is exactly where things fall apart.
This should get any budget owner's attention: this is a math problem, not just a trust problem. If paid traffic converts at 2% and a better post-click experience lifts that to 3%, effective cost-per-acquisition drops by a third, without spending a single extra dollar on ads. Improving the page does the same job as lowering cost-per-click, except it applies across the entire budget at once. That's the simplest version of the mismatch, and it affects more than half of all campaigns.
So the thesis here is straightforward. Post-click alignment isn't a design nicety or a job for whoever's free to touch the website. It's a system. The ad, the landing page, and the offer need to work as one continuous argument, aimed at one specific intent. Break the thread anywhere, and the click that cost real money gets wasted before the page even had a chance to work. On average, 52% of B2B PPC ads point to a homepage instead of a dedicated landing page, per Unbounce, the most basic form of the mismatch.
What "alignment" means across the four post-click stages
Alignment gets treated like it's just about matching headlines. It's bigger than that. The post-click journey runs through four sequential stages, and any one of them can independently kill a conversion.
Stage one is load. Before a visitor reads a single word, the page has to render, and this is a technical problem before it's a messaging problem. The benchmark is Largest Contentful Paint under 2.5 seconds on mobile. Missing that causes the cost to occur twice. Once in lost conversions from people who never wait around to see the offer, and again in higher costs-per-click, because slow pages drag down Quality Score. Google's algorithm updates in 2025 also gave more weight to engagement signals like dwell time and scroll depth. A slow page doesn't just lose the visitor in front of it. It feeds bad signals back into the campaign itself.
Stage two is engage, the first few seconds after the page loads, when a visitor decides whether to keep reading or hit back. This is decided above the fold, before any scrolling happens. The diagnostic here is simple: watch scroll depth alongside time on page. If people land and leave without scrolling at all, the problem sits above the fold. If they scroll but still don't convert, the problem has moved to the next stage.
Stage three is convert, everything about CTA placement, form structure, and the friction that stands between interest and action. Stage four is confirm, the thank-you page and whatever follow-up comes right after. This stage gets skipped constantly, which is strange, because it's arguably the highest-intent moment in the whole relationship. Someone just said yes.
Most audits stop after checking one or two of these stages. But the constraint could be sitting in any of the four, and skipping stages means guessing at the fix instead of finding it.
Message match: the mechanics of making an ad and a page say the same thing
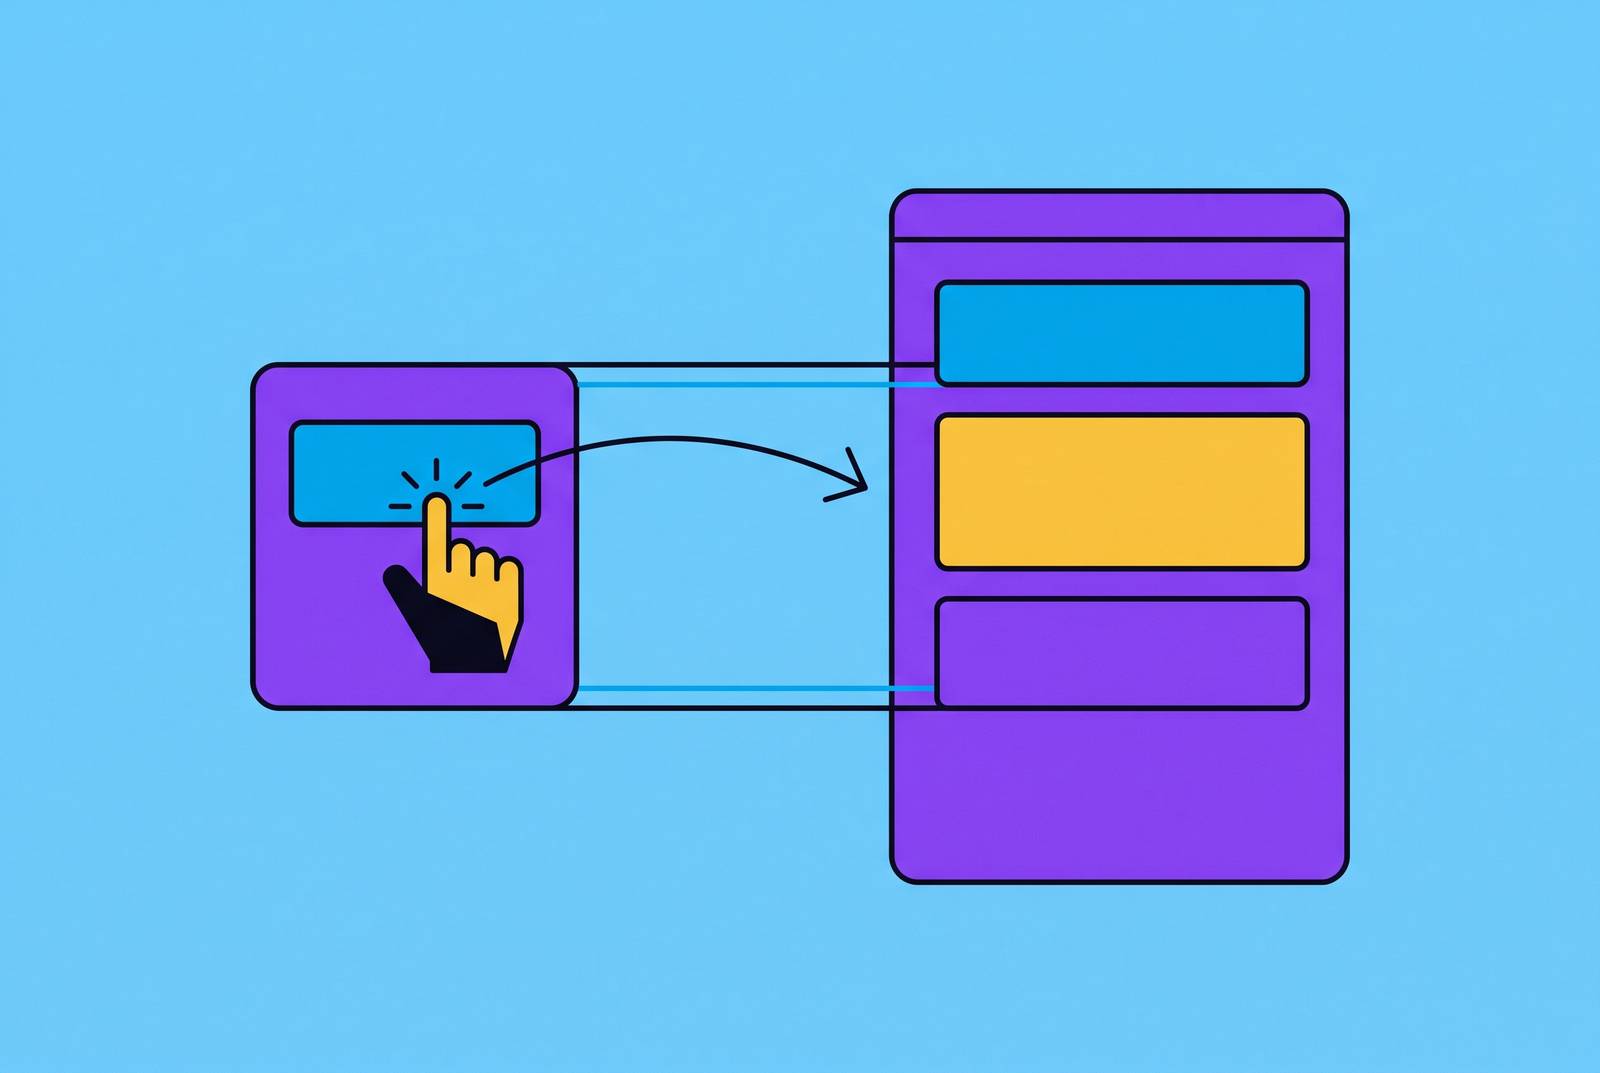
Message match is the single most common failure mode inside stage two, and it's more mechanical than it sounds. Three things need to line up. The headline on the landing page needs to mirror the ad's core promise. The imagery needs to reinforce the same context the ad set up.
Take a concrete case. An ad promises "5 Ways to Reduce SaaS Churn." The landing page headline should echo that exact promise, word for word in spirit, not soften it into something broader like "customer retention solutions". That broader phrasing might sound more professional, but it breaks the thread the visitor was following. They clicked for five specific ways to solve one specific problem. Anything vaguer reads as a bait and switch, even when it isn't meant that way.
Bounce rate is the clearest signal for catching this. Average B2B landing pages run bounce rates between 60% and 90%, and a well-matched page should sit closer to 40% to 60%. If paid traffic is consistently bouncing above 80%, message match is the most likely suspect. That's a useful rule of thumb before diving into anything more complicated. It also explains why the homepage trap is so damaging. A generic homepage simply can't meet the relevance and clarity that a strong Quality Score demands. Dedicated pages are structurally required here. They're structurally required.
One might argue tight keyword targeting used to be enough to handle relevance on its own. Not anymore. As Google leans further into broader query matching and more automated campaign types, the landing page is carrying more of the relevance burden than the keyword list ever did. And the payoff isn't only a better conversion rate. Aligning ad copy directly with what's on the page also lifts Quality Score, which quietly lowers costs across the whole campaign. Strong match rests on three concrete dimensions.
Personalization at scale: when one page serving many ad groups becomes a match problem
Message match gets harder, not easier, once a campaign grows. One landing page trying to serve ten different ad groups is a mismatch problem waiting to happen, because each ad group is carrying its own specific intent signal, and one page can't speak to all of them at once.
Two mechanisms handle this at scale. The first is dynamic text replacement, which swaps out headline or body copy based on whichever ad or keyword drove the click, while keeping the page's underlying structure the same. It's a lighter lift, good for stretching one page across many similar variations. The second is building dedicated page variants, separate URLs for each audience segment or campaign theme. That costs more to produce, but the lift is bigger, and it's worth the investment for high-volume or high-value segments.
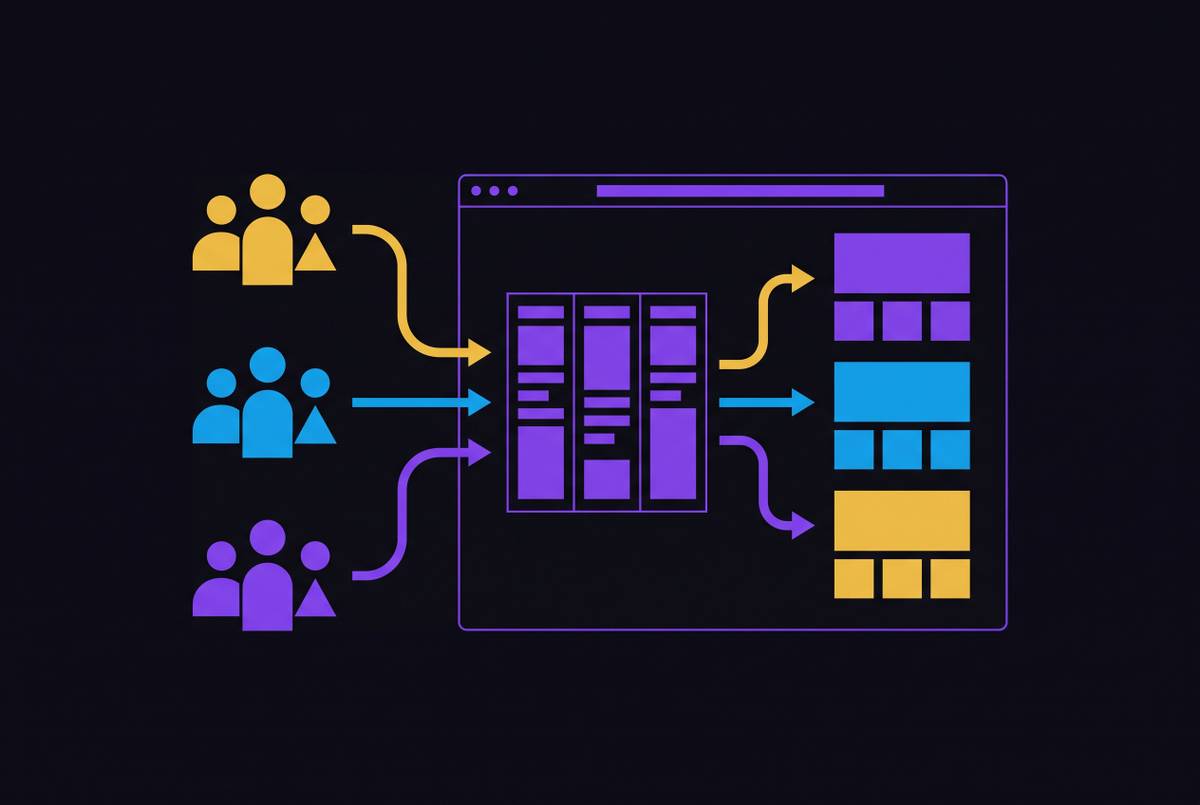
Either approach depends on knowing who's actually clicking. That means working out who the buyer is, what they're struggling with, and where they go to find information, then mapping each page variant to that specific intent rather than guessing at a middle ground that fits nobody well.
A tracking discipline makes this possible, and it's easy to skip and expensive to skip. Every landing page, whether it's for pricing, a demo, a free trial, or a content download, needs its own URL, so conversions get tracked and attributed separately. Without that, there's no way to know which variant is actually working. Optimization becomes a guess dressed up as a strategy.
LinkedIn campaigns make an especially good case for investing in variants, because the targeting is already so specific, by job title, company size, seniority, even named accounts. The audience walking in is pre-qualified before they ever click, so the page can afford to speak just as specifically back to them. A generic page thrown at a highly segmented audience wastes that precision. Personalized pages, matched to who's actually arriving, lift conversion probability across the board, while a single page trying to fit everyone tends to produce mediocre results for all of them.
What conversion benchmarks reveal about the gap between average and optimized
Averages hide the real story here. Something structural separates the bottom from the top, and it isn't luck.
Dedicated landing pages already do better than the general web average, converting at a median of 4.02% in 2026, nearly double the broader median. That's the baseline lift from simply building a page for the specific offer instead of pointing traffic at a homepage. Split by audience, B2B pages average 13.3% against B2C's 9.9% in certain measured cohorts, which seems backwards given how much longer B2B sales cycles run. But it reflects the nature of the traffic. B2B search intent tends to be sharper, and offers tend to be matched more tightly to a specific need.
Zooming into specific verticals makes the picture more textured. Average B2B conversion is 2.9%. SaaS pages trail that overall market at roughly 3.8%. IT and managed services run a 1.5% median, and cybersecurity comes in even lower at 1.3%, a number that makes sense once evaluation cycles for vendor displacement decisions often run a year or longer.
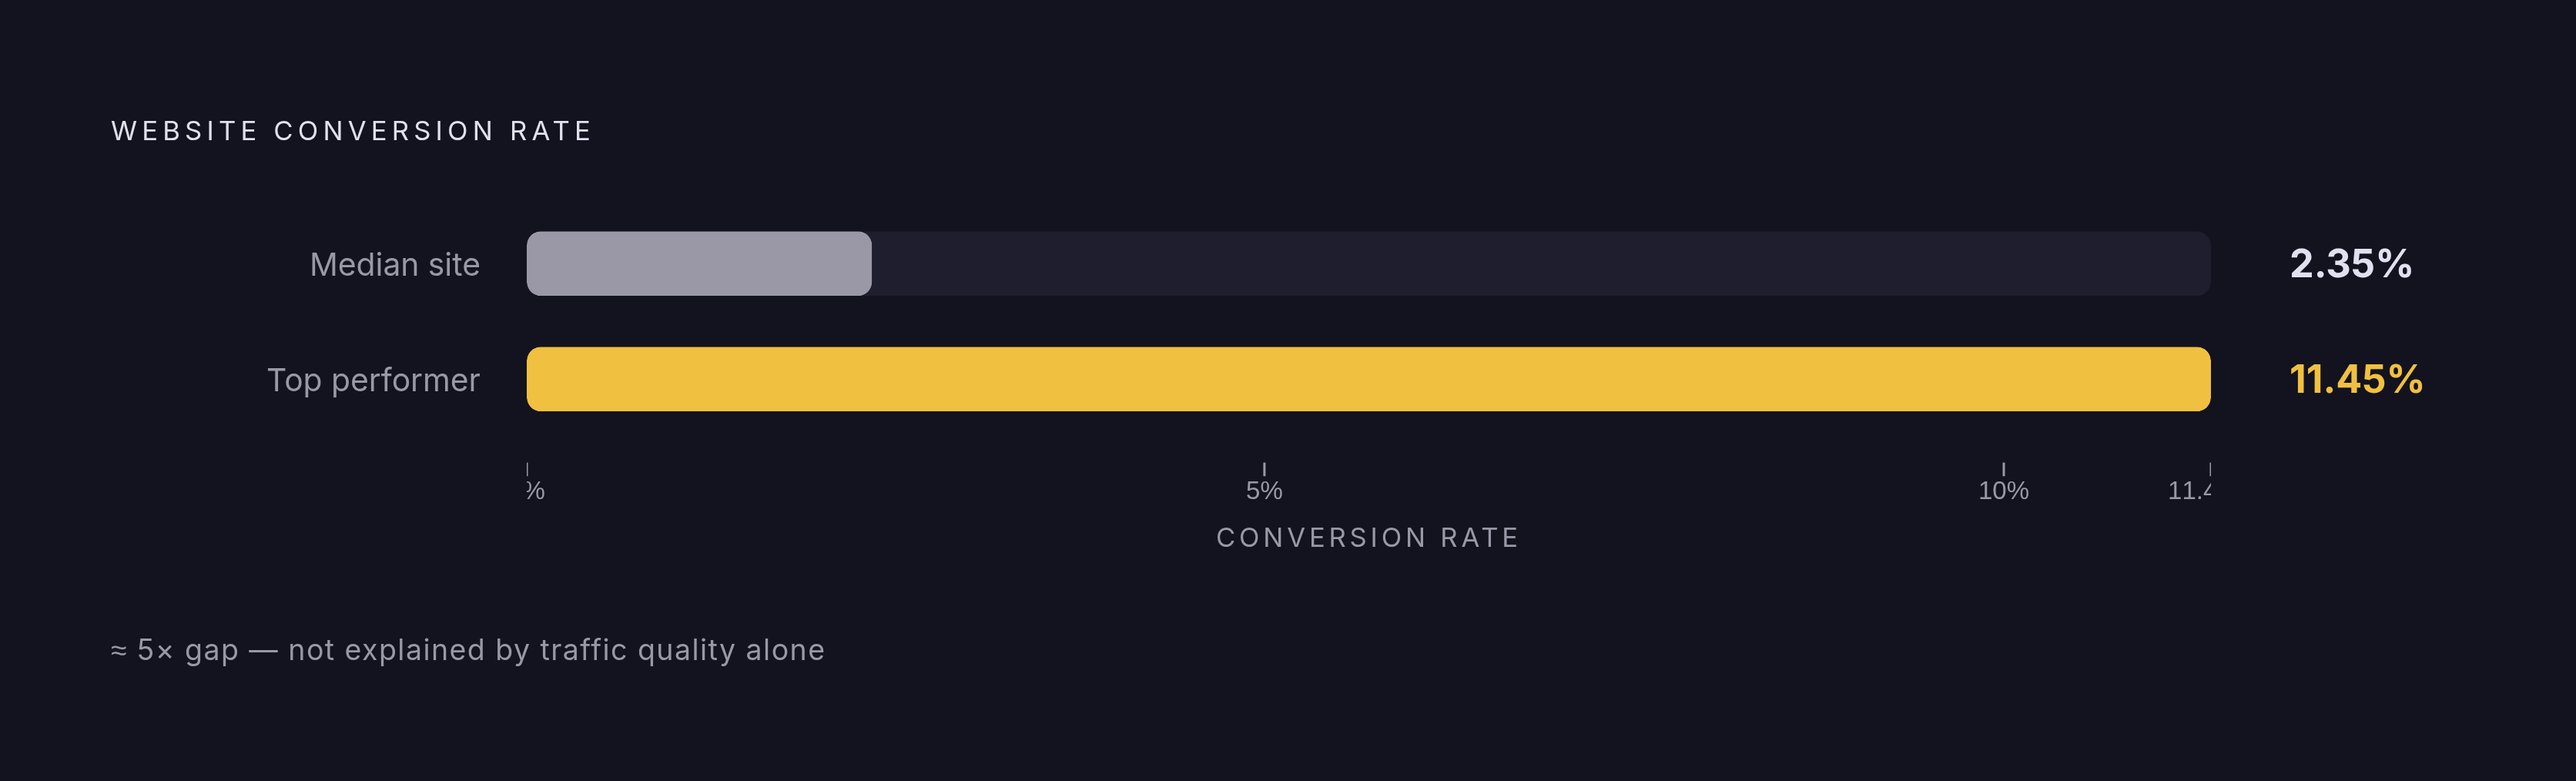
What does this mean in practice? Most teams check their number against a general average, see something close to 3%, and call it a win. But the real story is the systematic gap, across pages, forms, CTAs, and every post-click stage covered earlier, that separates an average performer from the top decile. These benchmarks serve as diagnostics rather than targets to hit in isolation. They're diagnostics. A cybersecurity page converting at 1.3% might be performing exactly as expected for its category. A general lead-gen page stuck at 2% might be badly underperforming what it's capable of. Same-looking number, very different verdict, depending on context. Rather than opening with the average, consider the spread: the median website conversion rate is 2.35%, while top performers reach 11.45%, roughly a 5x gap not explained by traffic quality alone.
Page structure elements that either support or break the conversion argument
Benchmarks explain how much room there is to improve. Structure explains where that improvement actually comes from.
Start with the CTA. Every extra option, another nav link, a second button, a row of social icons, chips away at the odds the visitor takes the one action that actually matters. Button language matters too. Passive text like "Submit" or "Learn More" should get replaced with something that names the payoff directly, "Claim Your Audit," "Schedule Consultation". The CTA should sound like the natural next line in the ad's promise.
Forms are their own battlefield. Every additional field is another reason to abandon ship, so the rule is simple: collect only what sales genuinely needs to make first contact. For higher-ticket B2B offers that require real discovery, breaking the form into multiple steps makes the process feel approachable instead of demanding, even though the total amount of information collected might be the same.
Social proof carries significant weight in B2B decisions, but testimonials that appear too late in the scroll (below where most visitors stop reading) contribute little. They need to sit close to the decision point, right where doubt occurs.
Mobile is no longer a secondary consideration. As of December 2025, mobile accounted for 54.23% of worldwide device share against desktop's 45.77%, and 86% of top-performing landing pages are built with mobile in mind. A page that breaks its own argument on a phone screen is breaking it for the majority of everyone who shows up.
For B2B specifically, the CTA is "Book a Demo," "Request a Quote," or "Talk to Sales," not "Buy Now"." It's "Book a Demo," "Request a Quote," "Talk to Sales". Selling to a committee, on a longer timeline, with more risk-aversion baked into the process, calls for a page that educates and builds trust before it asks for anything. A baseline shouldn't be optional: labeled form fields, sufficient contrast, keyboard navigation. Skipping accessibility doesn't just risk compliance problems. It locks out real visitors who need those accommodations to use the page at all.
Why testing volume compounds faster than any single optimization
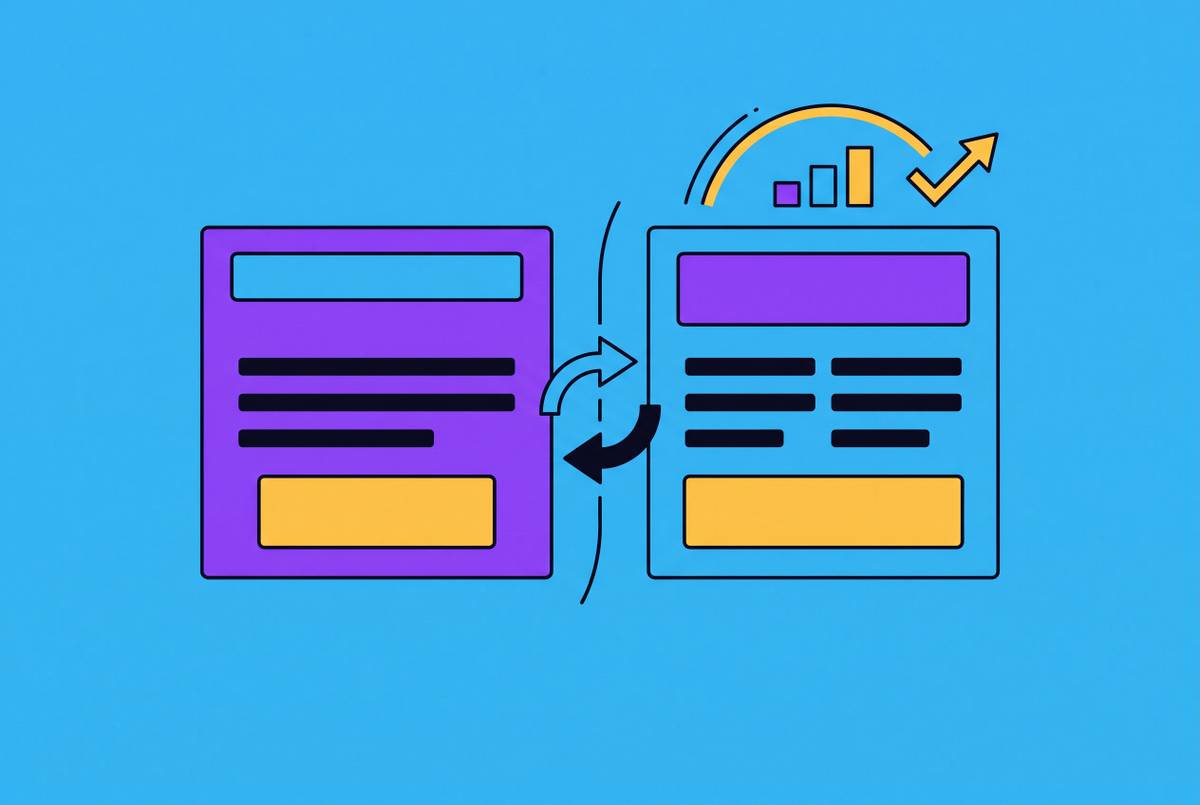
Here's an uncomfortable fact about A/B testing: only 13% of tests produce a result that's actually statistically significant. Most tests are inconclusive. That single fact reframes the whole discipline. The value isn't in running one perfect test and hoping it lands. It's in running enough tests that the wins, however rare per test, accumulate.
The data backs this up. Teams that test consistently see conversion gains in the 37% to 49% range on average, and companies running more than ten test variations see results 86% better than companies running just one. Volume is the primary driver of learning. It's the primary driver of learning.
And yet most teams aren't doing this at all. Only 17% of marketers actively A/B test their landing pages, which means the majority of paid media programs are running on assumptions nobody's actually checked. That's a strange place to be spending real ad budget every month.
The volume effect also appears at the page-count level. That's not because forty pages are magically better designed. It's because forty pages mean forty chances to match a specific intent, and forty separate places to learn what's working. The gains tend to cluster around a familiar handful of surfaces, headline, form, speed, CTA, and mobile.
How AI changes the pace and architecture of post-click optimization
If testing volume is the lever, AI is what makes pulling that lever cheap enough to do constantly. AI can cut landing page creation time by as much as 90%, which turns "one new page a month" into "ten new pages a month," and that changes what compounding learning looks like over a single quarter. It's that there are simply more of them, running faster.
In certain cohorts, AI-generated pages overall convert 37% higher than human-written control pages. On personalization specifically, AI-driven dynamic pages convert roughly 25% higher than static pages among mobile visitors, tying together the mobile-majority reality and the personalization-at-scale argument from earlier sections into one number.
But adoption and impact are two very different things. A large majority of organizations, 88%, already use AI somewhere in the business, yet only 6% qualify as genuine high performers where AI is meaningfully moving the bottom line. Using the tool isn't the same as building the architecture around it that makes it compound. The more sophisticated setups now run multiple specialized agents that pass context between each other and chain tasks together across a workflow, closer to how a coordinated human team would divide the work than to a single tool doing everything at once.
That architecture shift is arriving fast. By the end of 2026, an estimated 40% of enterprise applications will include task-specific AI agents, up from under 5% in 2025. The window where this counts as a competitive edge, rather than table stakes, is closing quickly. The underlying principle that ties all of it back to testing volume: every test, every variant, every AI-generated iteration leaves behind evidence, what worked, what flopped, which audience responded. The next decision starts from that history instead of a blank page. AI-generated copy lifts conversions by +3% on B2B SaaS and +4% on lead-gen forms.
Measuring post-click performance: connecting ad data to page behavior to pipeline
None of this matters without a way to actually measure it. Standard ad platform metrics, impressions, click-through rate, cost-per-click, all stop at the moment of the click. They say nothing about what happened next. Measuring post-click performance means bridging ad platform data with what's actually happening on the page.
A handful of metrics do most of the work. Landing page conversion rate by ad source shows what percentage of paid visitors actually completed the intended action, and it lives in Google Analytics 4 or the ad platform's own reporting. Bounce rate segmented by UTM source separates paid traffic behavior from organic, and anything sitting above 80% on paid traffic is a strong signal of a match problem. Scroll depth shows exactly where attention drops off: visitors who leave without scrolling point to a problem above the fold, while visitors who scroll but never convert point to friction in the form or the CTA.
Form abandonment rate, the percentage of people who start filling out a form but never finish, is trackable through tools like Hotjar or GA4's funnel exploration. Thank-you page load rate confirms actual completions against what the ad platform reports as conversions. Any gap between those two numbers points to attribution leakage somewhere in the chain.
Put together, these metrics turn the post-click experience from a guess into a system that can actually be measured, stage by stage, from the click all the way to pipeline. That's the whole argument in practice: the ad gets someone to the door, but everything that decides whether they walk through it happens after, and now there's a way to prove it.
Sources
- PPC landing page optimization best practices (2025 guide)
- Over Half of Marketers Send Paid Traffic to the Wrong Destination Pages - Demand Gen Report
- 100+ Landing Page Statistics You Should Know (2026)
- Landing Page Statistics 2026 (Backed by Data Marketers Actually Use)
- B2B conversion rates 2026: hit 8% (benchmarks) | NUMRIQ