Customer Acquisition Cost Calculation for B2B Advertisers
Most B2B teams measure CAC wrong, then misread what the number actually means.
Most B2B marketers get CAC wrong twice. First they build the number badly. Then, even when the math is right, they read it like a scoreboard instead of what it actually is: a symptom.
Here's the formula everyone learned in their first marketing job: total spend divided by new customers. Fine. Correct, even. I've just never once seen it implemented the way it's taught.
What goes into a fully-loaded CAC — and what most teams leave out
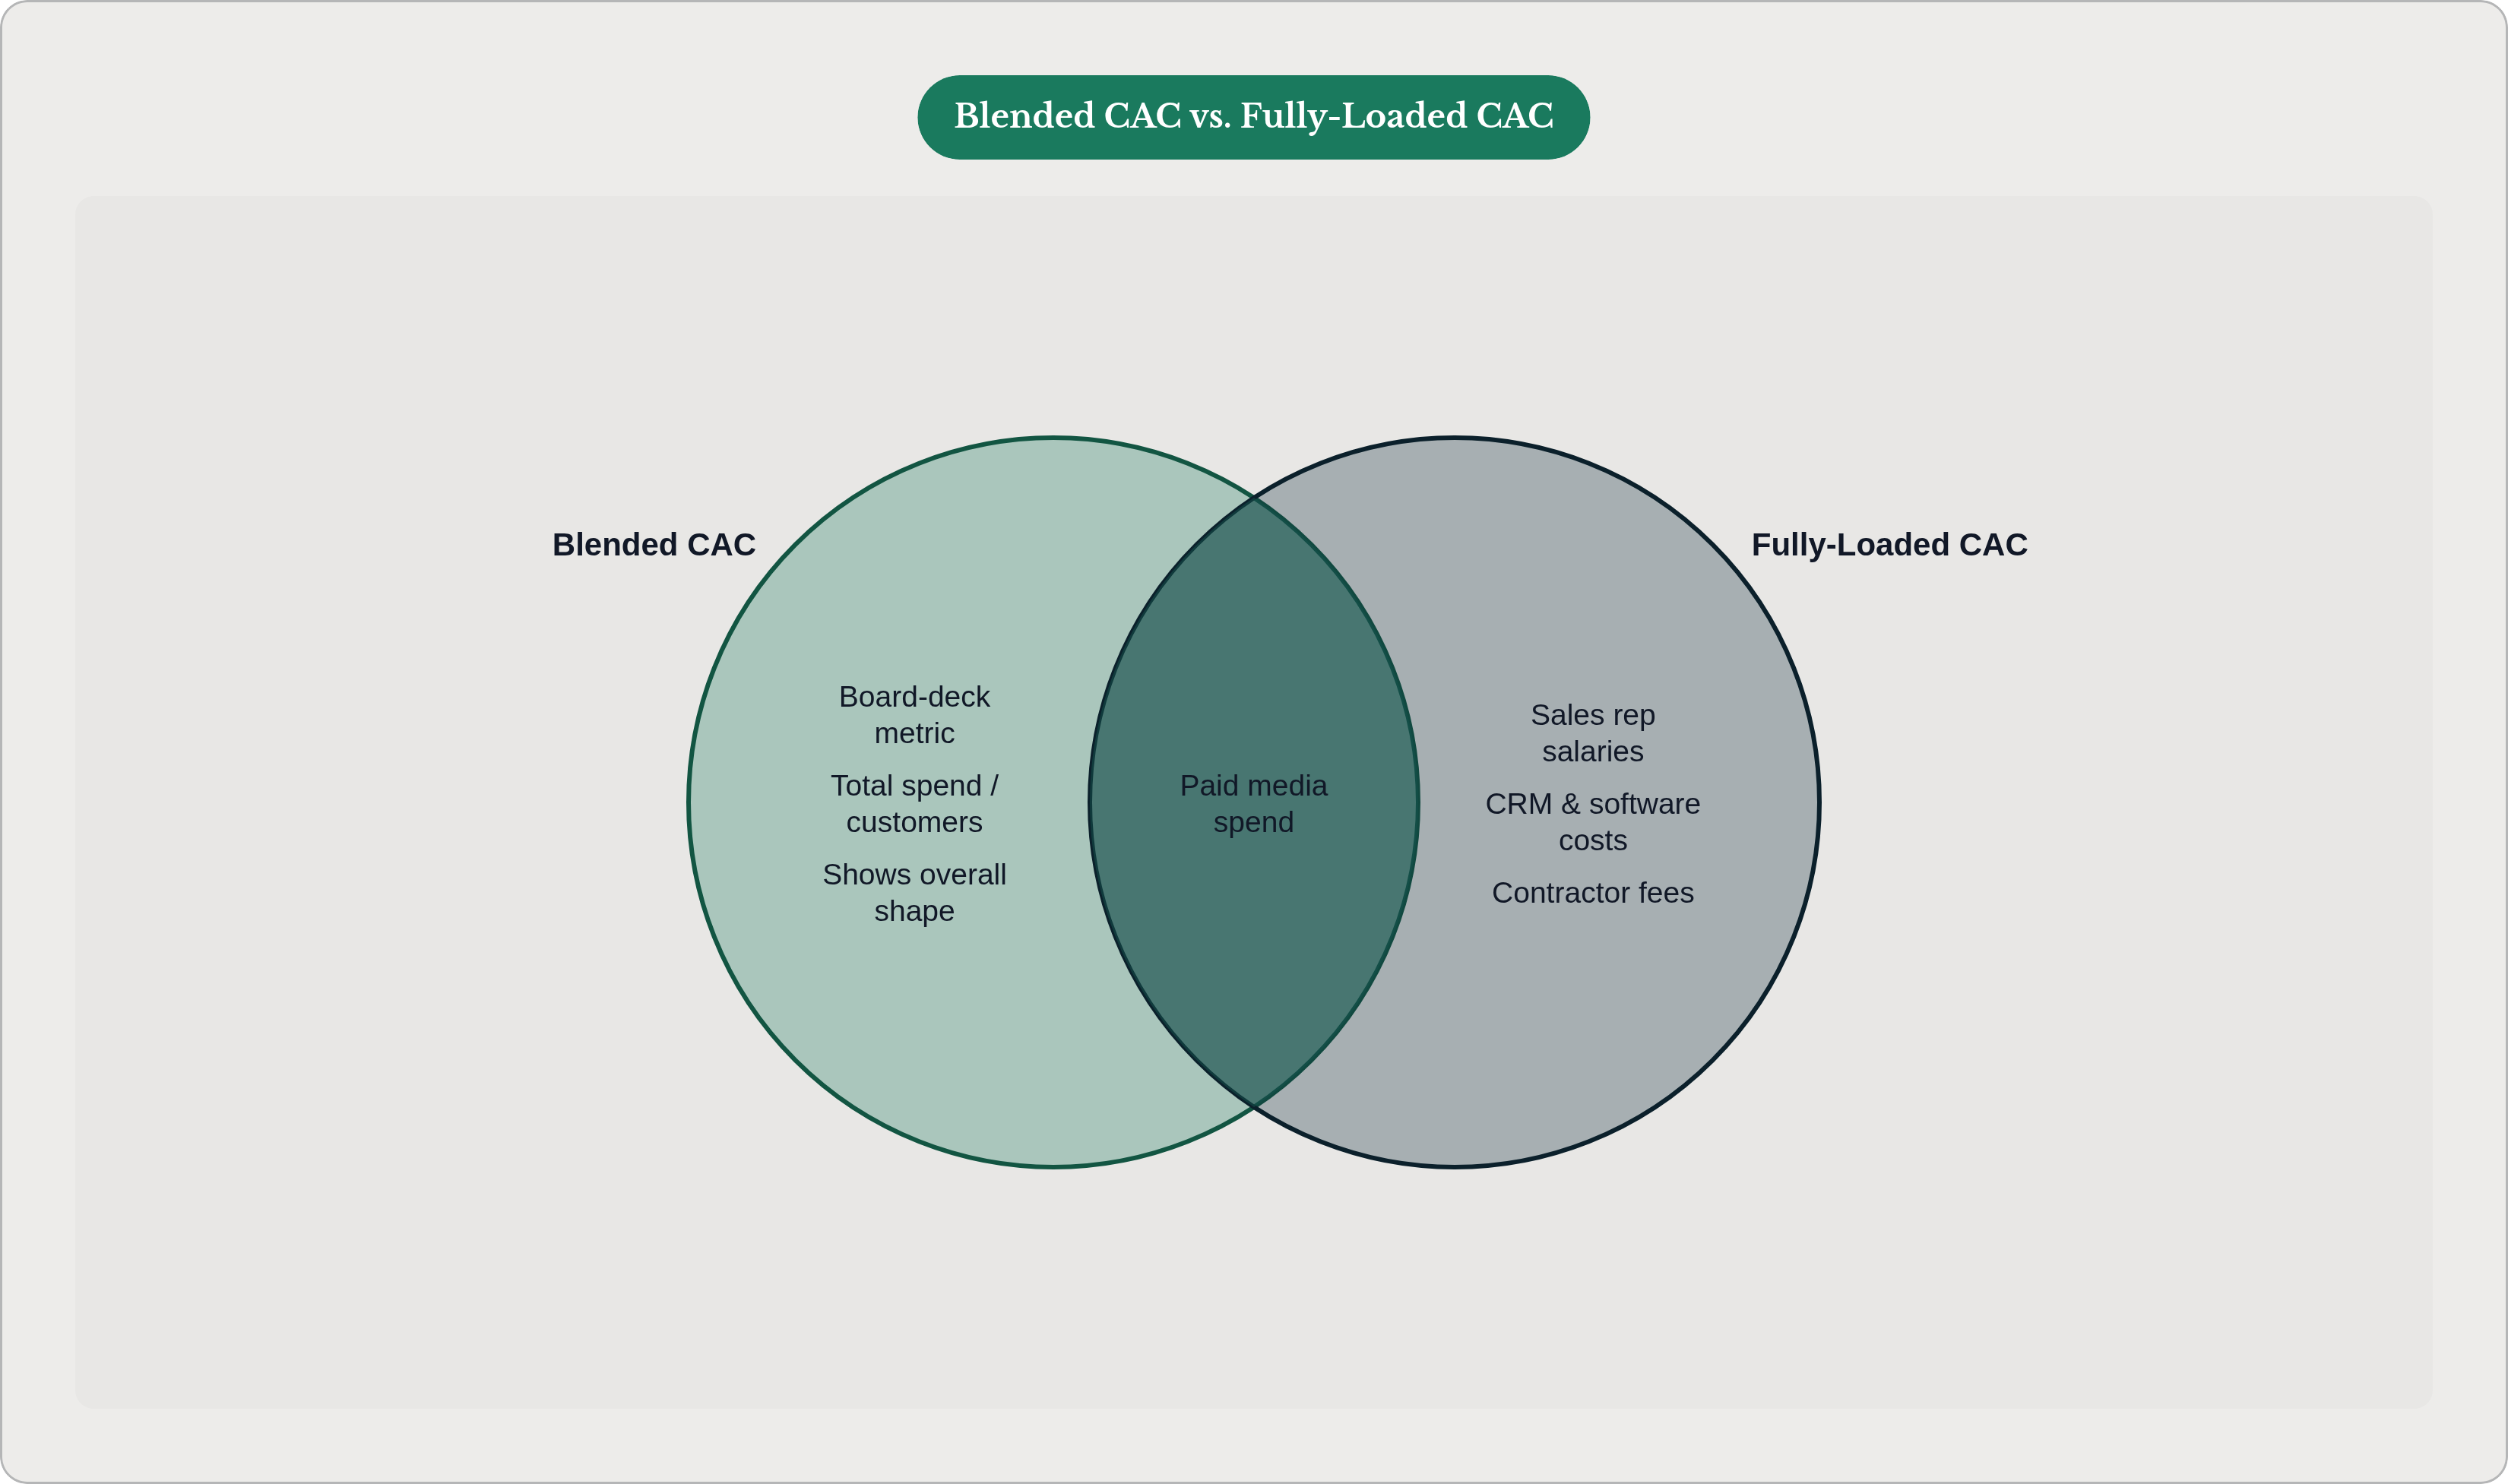
Ask ten marketers what's in their CAC numerator and you'll get ten different answers. Most say "ad spend." A few remember agency fees. Almost nobody counts the sales rep's salary, the slice of the CRM bill tied to new logos, or the freelancer who cut last quarter's LinkedIn video.
Here's what actually belongs in there:
- Paid media spend, every channel
- Agency and contractor costs (the single biggest omission I see, by a wide margin)
- Marketing software and attribution tools
- Content production: copy, design, video
- The portion of sales comp tied to new logos, not renewals or upsells
Skip those, and CAC looks great. Payback looks fast. Channels look efficient. None of it's true. You're just measuring with a ruler missing a few inches, and you won't find out until the budget's already spent.
There are two honest versions of this number, and the problem isn't picking one. It's using the wrong one for the decision in front of you.
Blended CAC (total spend over total customers) is a fine board-deck number. It shows the shape of things. Fully-loaded CAC (the one with salaries and tools and overhead baked in) is the one that tells you whether the program actually makes money. If you're deciding where next quarter's dollars go, that's your number, not the other one.
Then there's the denominator, which causes more arguments than it should. What's a "new customer"? A logo? An ARR-weighted account? Something still half-closed? Every definition gives you a different answer. Pick one, write it down somewhere everyone can see it, and leave it alone for at least four quarters. Change the definition mid-year and you're comparing two different metrics wearing the same name tag.
And then the cohort trap, which catches people who should know better. Most teams count a customer the day the deal closes, not the day the spend that produced it went out the door. B2B sales cycles run six to twelve months routinely. Spend from January can close in September. Credit that customer to September's budget and your ratio is lying to you. Group by when the money went out, not when the contract got signed.
Channel-level CAC and why blending hides more than it reveals
Say your blended CAC is in the mid-hundreds. Is that half that from one channel and triple from another? Because those are two completely different stories, and blending flattens them into one number that tells you nothing useful.
Google Search and LinkedIn don't share a cost structure, a buyer-intent level, or a job in the funnel. Averaging them is like taking the temperature of a room that's on fire on one side and freezing on the other and reporting "comfortable."
Split it by channel and you actually get to make decisions:
- Which channels earn their spend
- Which ones are being carried by cheaper channels hiding in the blend
- Where moving a dollar would actually move the number
In practice: attribute direct costs to the channel that generated them (platform spend, channel-specific creative, channel-specific tools), then split shared costs like sales salaries proportionally. It won't be exact, and it doesn't need to be. A rough, directionally sound channel split beats a clean blended number that answers nothing.
Timing makes this worse. LinkedIn brand campaigns and Google bottom-funnel campaigns run on different clocks entirely. Judge both on a 30-day window and you'll punish the upper-funnel spend for doing its job slowly, which is the only way it knows how to do it. Match your measurement window to your actual sales cycle, not whatever the dashboard defaults to.
And one thing worth saying plainly: cost per lead is not CAC. It's an input. CAC is the output. Chase cheap leads and watch CAC climb anyway, because you filled the funnel with people who were never buying anything.
What CAC benchmarks actually tell you — and the B2B range you're operating in
If you want a single "good CAC" number to aim for, I don't have one, and neither does anyone else. First Page Sage tracked US B2B data from January 2022 through August 2025 across 27 industries, and blended CAC ranges from $86 to $1,143. That spread alone should tell you something: anyone handing you an industry benchmark as a hard target is selling you something.
One thing does hold up across nearly every industry, though: organic CAC beats paid CAC, consistently. First Page Sage puts organic at $942 against $1,907 for paid. A healthy-looking blended number can be hiding an expensive paid program behind cheap organic traffic. Split them and the real cost shows up.
A few numbers to anchor on:
- B2B SaaS: $239 blended ($205 organic, $341 paid)
- Financial services: $784 blended, with paid ($1,202) nearly double organic ($644)
- Healthcare and health tech: among the highest figures in the dataset
Deal size explains most of the spread. Bigger deals cost more to close, which is fine as long as lifetime value covers it. SaaS benchmarking still leans on 3:1 LTV:CAC as the rule of thumb, and B2B has room to spare there: average B2B LTV, per First Page Sage, is $32,414 against $10,089 for B2C. That gap is exactly why B2B can absorb a higher CAC and still win.
But a benchmark can't tell you if your CAC problem is a cost problem, a conversion problem, or a mix problem. For that you actually have to read the number instead of just comparing it to someone else's.
Reading your CAC number as a diagnostic, not a verdict
CAC answers one question: what did we pay. It doesn't answer why, and it definitely doesn't tell you what to fix. Treat it like a symptom. A fever tells you something's wrong; it doesn't tell you what.
When CAC moves, it's almost always one of four things:
- Creative. CPC looks fine, nothing downstream converts. Wrong people clicking, or the right people not caring.
- Landing page. Click-through is healthy, form fills aren't. The ad did its job. The page didn't.
- Attribution. A channel is influencing deals and getting no credit for it. Its CAC looks inflated, so you cut its budget, which is exactly the wrong move.
- Funnel and handoff. Pipeline exists, it's just not turning into customers. CAC is high because closing is slow, not because acquisition is expensive.
Direction over time tells its own story, if you're watching for it. Blended CAC rising while channel-level CAC holds steady usually means your mix shifted toward pricier channels (that's a budget question). CAC rising everywhere at once usually means platform costs went up or your conversion rate dropped broadly (that's a creative or landing-page question). And stable CAC next to declining pipeline quality? That one should worry you. It usually means someone's counting leads in the denominator that were never going to buy anything.
Worth adding payback period to this picture too: how many months to recover the acquisition cost from gross margin. Private SaaS companies routinely take over a year. That number tells you how much cash your growth actually demands, which is a more useful question than "is our CAC good."
None of this works without the right data underneath it: channel-level numbers, cohort tracking, something that ties spend to closed-won revenue. Platform dashboards alone will not get you there; they were never built to.
How paid media execution on Google and LinkedIn directly shapes your CAC
Google and LinkedIn aren't interchangeable line items, no matter how often they get treated that way in a media plan. They do different jobs. Treat them the same and you'll inflate CAC on both at once.
Google Search catches people who are already looking. Shorter path to conversion, but crowded and getting pricier by the quarter. LinkedIn builds pipeline before intent even exists, targeting by role and company and behavior, and it needs more runway to prove itself. Run identical creative, the same landing page, and the same 30-day window on both, and you'll misjudge them both.
On Google, a few things move CAC directly:
- Match type. Exact and phrase match on product-category and pain-point terms keep spend close to actual intent. Broad match without a strong negative keyword list is how budget disappears on searches that were never going to convert.
- The AI Overviews shift. Top-of-funnel informational searches have been losing ground to AI-generated answers, organic and paid both. Heavy spend there now likely buys traffic that converts at a fraction of what it used to. Budget belongs on bottom-funnel, transactional, branded terms.
- Landing page match. Sending sharp search intent to a generic homepage is one of the most common, and most fixable, CAC problems out there.
On LinkedIn:
- Precision beats reach. Job title, company size, industry, tech stack, that's how you reach actual decision-makers. Wide audiences just cost more for a worse outcome.
- Format matters. Thought Leader Ads, built around a real person's voice, often beat standard brand creative. Document Ads and Sponsored Content built on real assets (benchmarks, guides) tend to earn genuine engagement instead of scroll-past clicks.
- Retargeting people who already raised a hand (pricing-page visitors, content downloaders) is one of the cheapest CAC levers there is, because you're spending on warm accounts instead of cold ones.
The trap that undoes all of it: optimizing to form fills or platform-reported conversions instead of closed-won data. A channel with expensive-looking leads that close at a high rate can have a lower true CAC than a channel throwing off cheap leads that never turn into anything. Look only at cost-per-lead and you'll never catch that.
What accumulating campaign data does to CAC over time
CAC in month three is almost always worse than CAC in month eighteen. That's not a broken program. That's a program still learning what works.
Early spend exists to generate data, mostly. That data shapes targeting, creative, bidding, landing page tests. Each round starts from what the last one taught you instead of a blank page.
What actually compounds:
- Audience signals. Which titles and company sizes and intent signals turn into real pipeline versus which ones just generate form fills that go nowhere
- Creative learning. Which messages land with your actual ideal customer, not with anyone who happens to click
- Conversion path data. Where spend is leaking out, whether that's the ad, the page, the handoff, or sales itself
None of this compounds without the infrastructure to catch it. Google Ads and LinkedIn Campaign Manager will show you cost-per-lead forever. Neither will tell you which leads became paying customers. That link only exists if your CRM talks to your ad platforms and your attribution model actually connects spend to closed-won revenue. Skip that step and every new campaign starts from zero, no matter what you spent or learned last quarter.
There's an organizational piece here too, and it's the one people underrate. A campaign launched, checked once, then left alone while the team chases the next fire doesn't compound; it just sits there decaying. A campaign under continuous, active attention does. One cybersecurity vendor I've seen data on moved to AI-led campaign management and saw CAC drop meaningfully within two quarters, alongside a real lift in opportunities, purely from ongoing creative rotation and intent-based targeting adjustments. That's the payoff. It only shows up when someone's actually watching.
Why the management model around paid media determines whether CAC improves or stagnates
Who runs the campaigns matters almost as much as the math behind them. Three setups show up most often, and each handles the CAC question differently.
In-house teams know the company better than anyone else ever will. That's real, and it matters. But bandwidth runs out, and campaigns drift onto autopilot between quarterly check-ins. Compounding needs small, constant adjustments, not a review every ninety days.
Agencies bring extra hands and sometimes better tools, but watch the incentive structure. An agency paid as a percentage of media spend has a built-in reason to recommend more budget over more efficiency, whether anyone admits that out loud or not. And their reporting tends to stop at impressions and CPL, well short of pipeline and closed revenue.
DIY software hands the whole job back to you. It'll give you data all day. It won't tell you whether creative, landing page, attribution, or funnel is the thing actually driving your CAC up, and it certainly won't fix it.
What actually works, regardless of which of the three you're using, comes down to a short list of habits:
- Watching performance continuously, not monthly, so a cost spike or tired creative gets caught in week two, not buried in next quarter's report
- A closed loop connecting ad performance all the way through to pipeline and closed revenue, not just platform metrics
- Someone whose name is on the outcome, someone you can actually ask "why did CAC go up last quarter" and get a real answer from, not a shrug
That last one gets skipped constantly, and it's the one that matters most. A CAC number without an owner is just a number sitting in a report nobody reads twice. Give it an owner, give that owner channel-level data and the context to read it, and it finally becomes what it was supposed to be from the start: a way to find out what's actually broken.