Customer Lifetime Value Calculation for B2B SaaS
Most B2B SaaS companies calculate lifetime value wrong, overstating it by 35% to 66%.

Here's a fun exercise. Pull up your LTV formula right now. Actually look at it, and take it seriously. If it's ACV times average lifespan, and nowhere in there is a line for cost of delivering the product, I need you to sit with that for a second, because you're not calculating lifetime value. You're calculating lifetime revenue and calling it something fancier.
That mix-up is common. Most of the free calculators floating around, most of the spreadsheet templates people inherit from the last person in the seat, just multiply ACV by lifespan and stop. Revenue in, LTV out. There's no margin step at all.
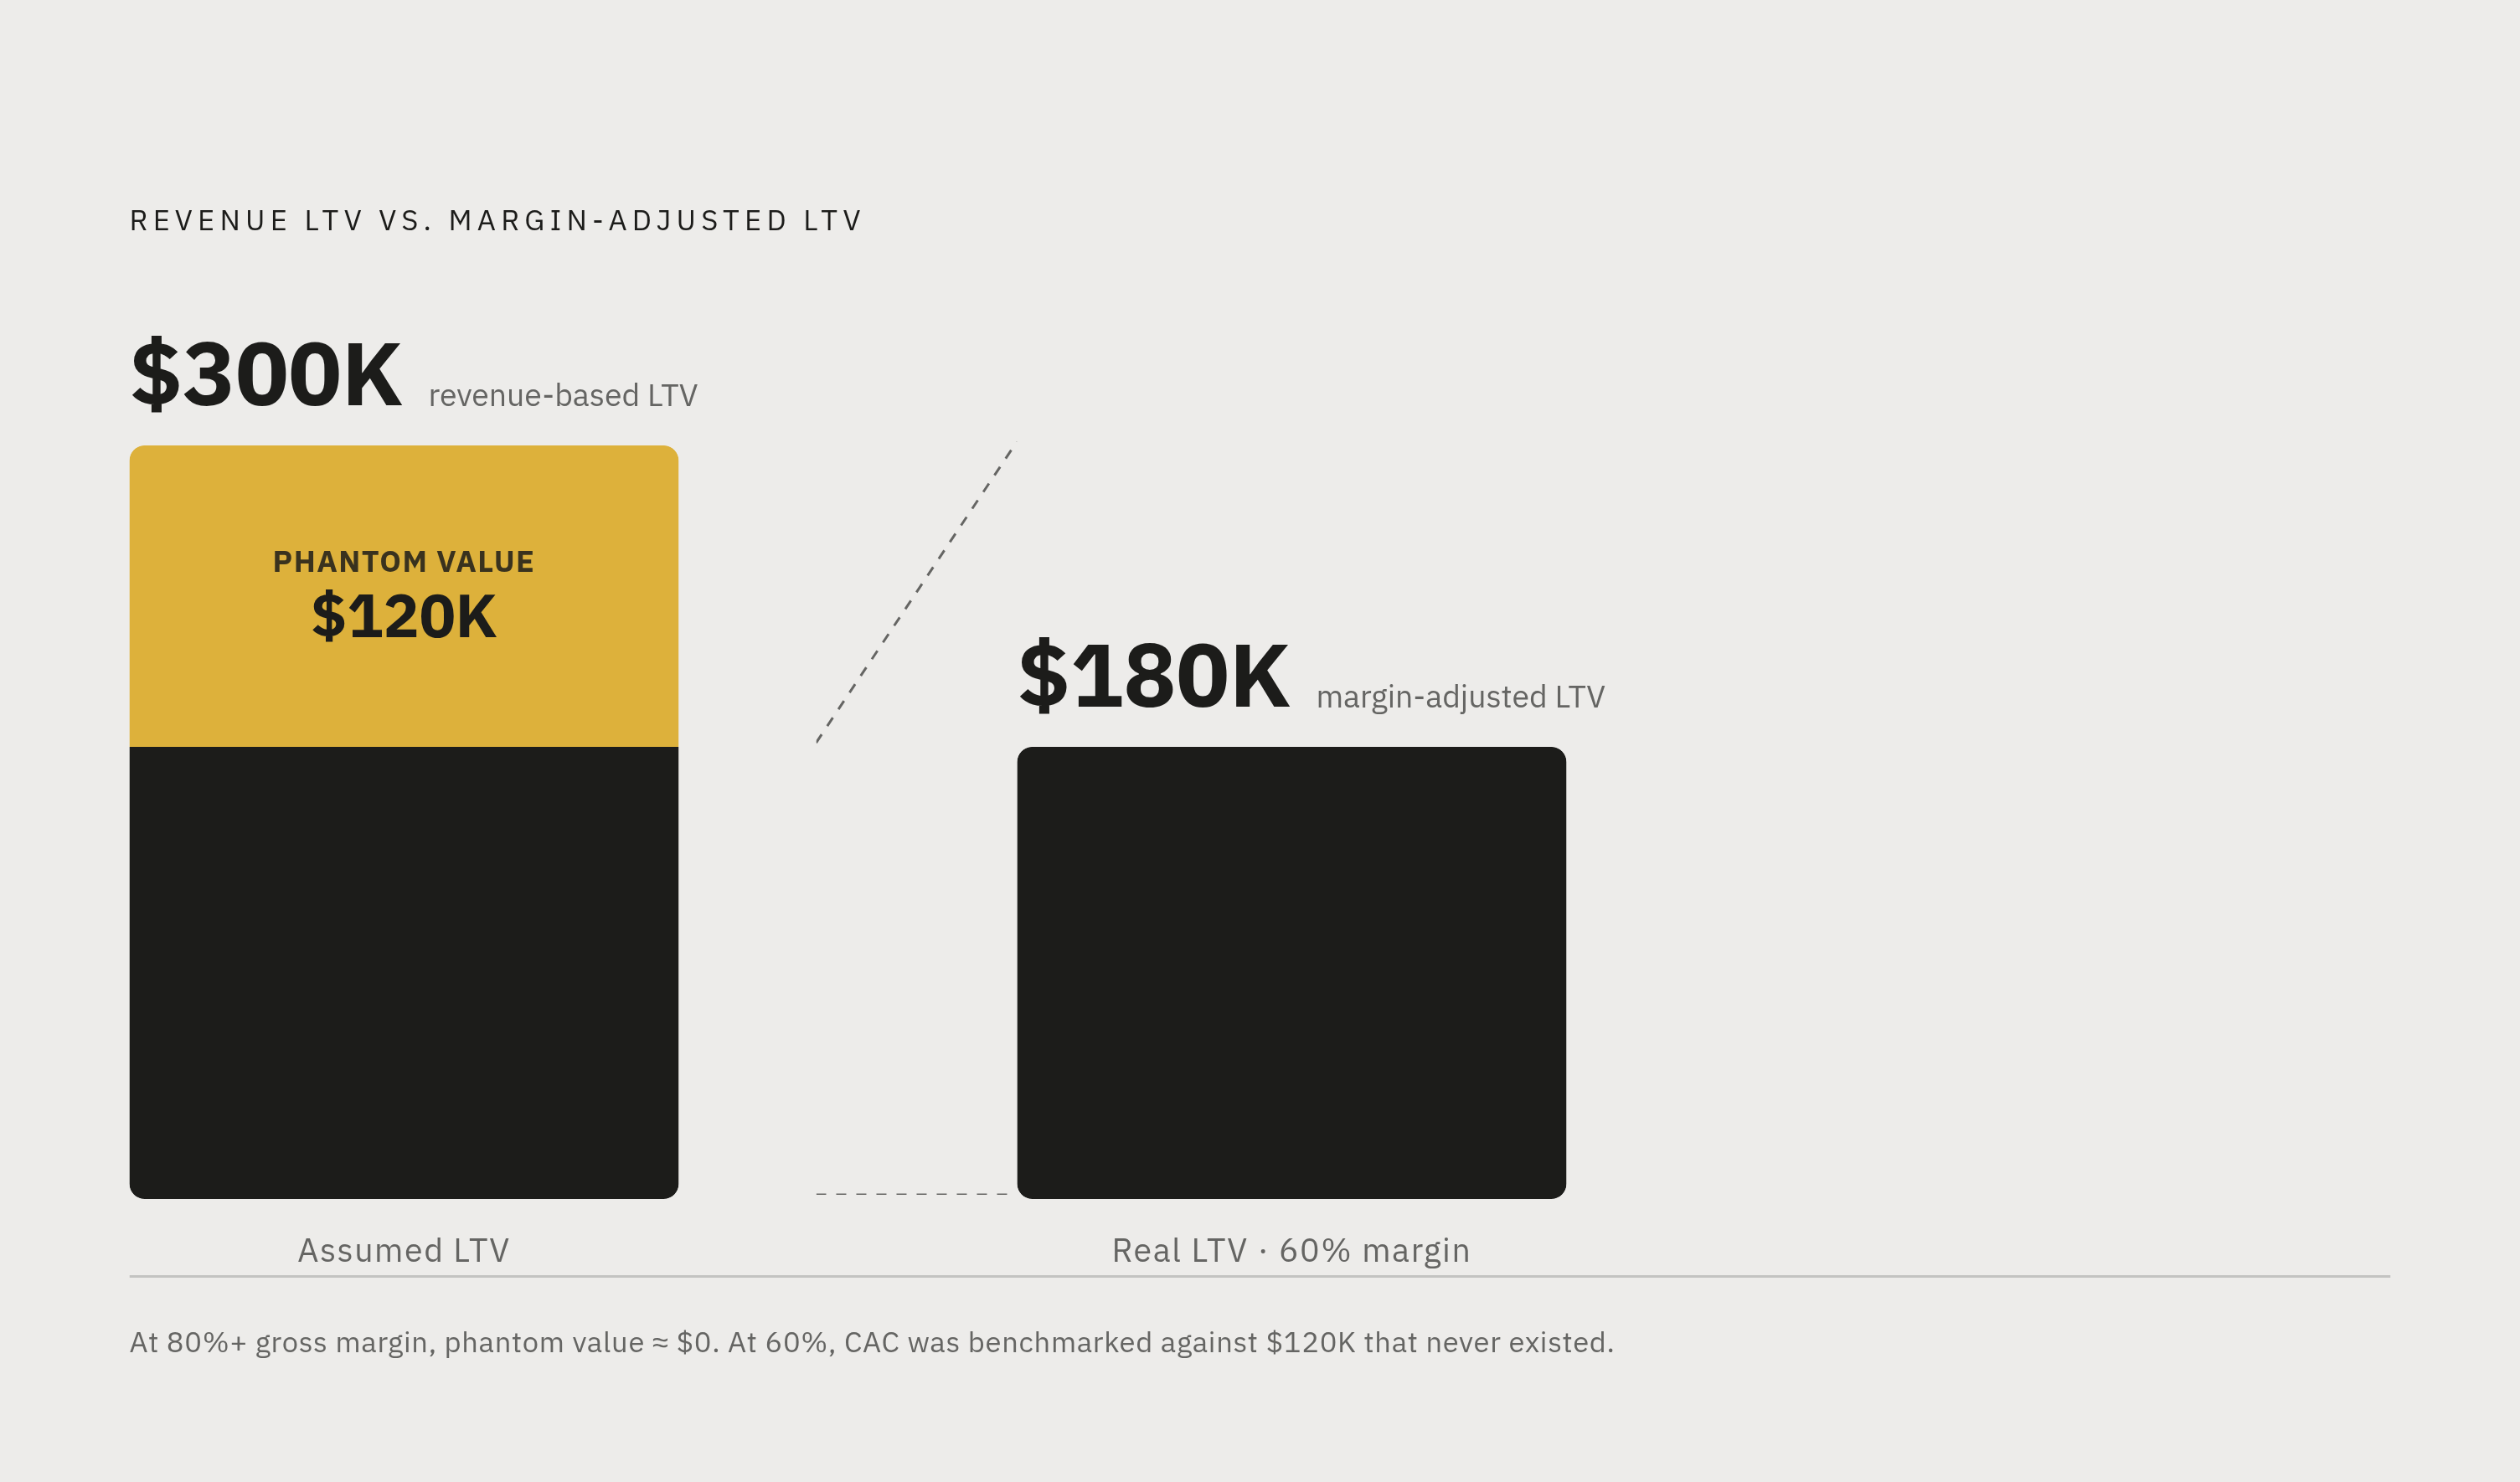
If you're a clean 80%+ gross margin software company, fine, that shortcut barely costs you anything. But most B2B SaaS isn't that clean anymore. You've got an implementation team. A customer success org doing actual hands-on work. Maybe a "human in the loop" somewhere making the product function the way it's marketed to function. That pulls margin down toward 60%, and at 60% margin, skipping the adjustment can overstate LTV by something like 66%.
Sit with that number for a moment. A company thinks its average customer is worth $300K. The real figure, after you subtract what it costs to actually serve them, is closer to $180K. And CAC got set against the fake number.
What should actually be in that margin line:
- Cost of revenue, the obvious one nobody forgets
- Infrastructure that scales per account
- CS headcount tied to that account
- Implementation and onboarding costs
Most companies stop at the first item. That's not a rounding error, it's a blind spot, and it's usually the three skipped items that decide whether your unit economics are real or imaginary. Before you touch the formula at all, go figure out your actual gross margin per account. Not the blended company number. Not whatever the accounting team reports if it leaves out CS and implementation. Get the real one.
Early churn is concentrated, not distributed (and that changes the math significantly)
Ask yourself this: is a customer in month 3 as likely to churn as a customer in month 33? Rarely, and most people who've run a SaaS business sense this. And yet the standard formula assumes something close to that, an even, flat churn rate applied across the whole lifespan like it's a mortgage amortization schedule.
It isn't. Something like 40% of all churn happens in the first 90 days, and it's rarely a "the product isn't good enough" problem. It's an implementation problem. The customer never got set up right, never saw the thing work, and left before the relationship ever really started.
A formula that spreads churn evenly is quietly doing two things wrong at once. It overweights the later months, where everyone left is, by definition, a survivor. And it underweights the early months, which is where most of the actual damage happens.
Then there's survivorship bias stacked on top, and this one's sneaky. If you calculate average lifespan by looking at your current customer base's history, you are, by construction, mostly looking at people who lasted long enough to still be customers. The early churners already left. They're not in your dataset. Which means the lifespan number you're calculating is built largely from the customers who survived, and it can overestimate real lifespan by something in the 40-60% range.
The fix isn't complicated, it's just tedious:
- Track every customer who started in a given month or quarter, churned-in-week-two customers included
- Build retention curves at the cohort level, not off whoever happens to still be paying you today
- Expect a steep drop early and a flat tail late. That shape tends to be closer to the truth, and a straight diagonal line is fiction.
And here's the part that should change how you think about spend: if most of that churn is implementation, not fit, the answer probably isn't "lower CAC." It's "fix onboarding" instead. You likely didn't overpay for these customers. You paid for them, then lost them before they had a chance to become valuable. It's a different problem with a different fix.
Expansion revenue doesn't just improve LTV (it breaks the formula that ignores it)
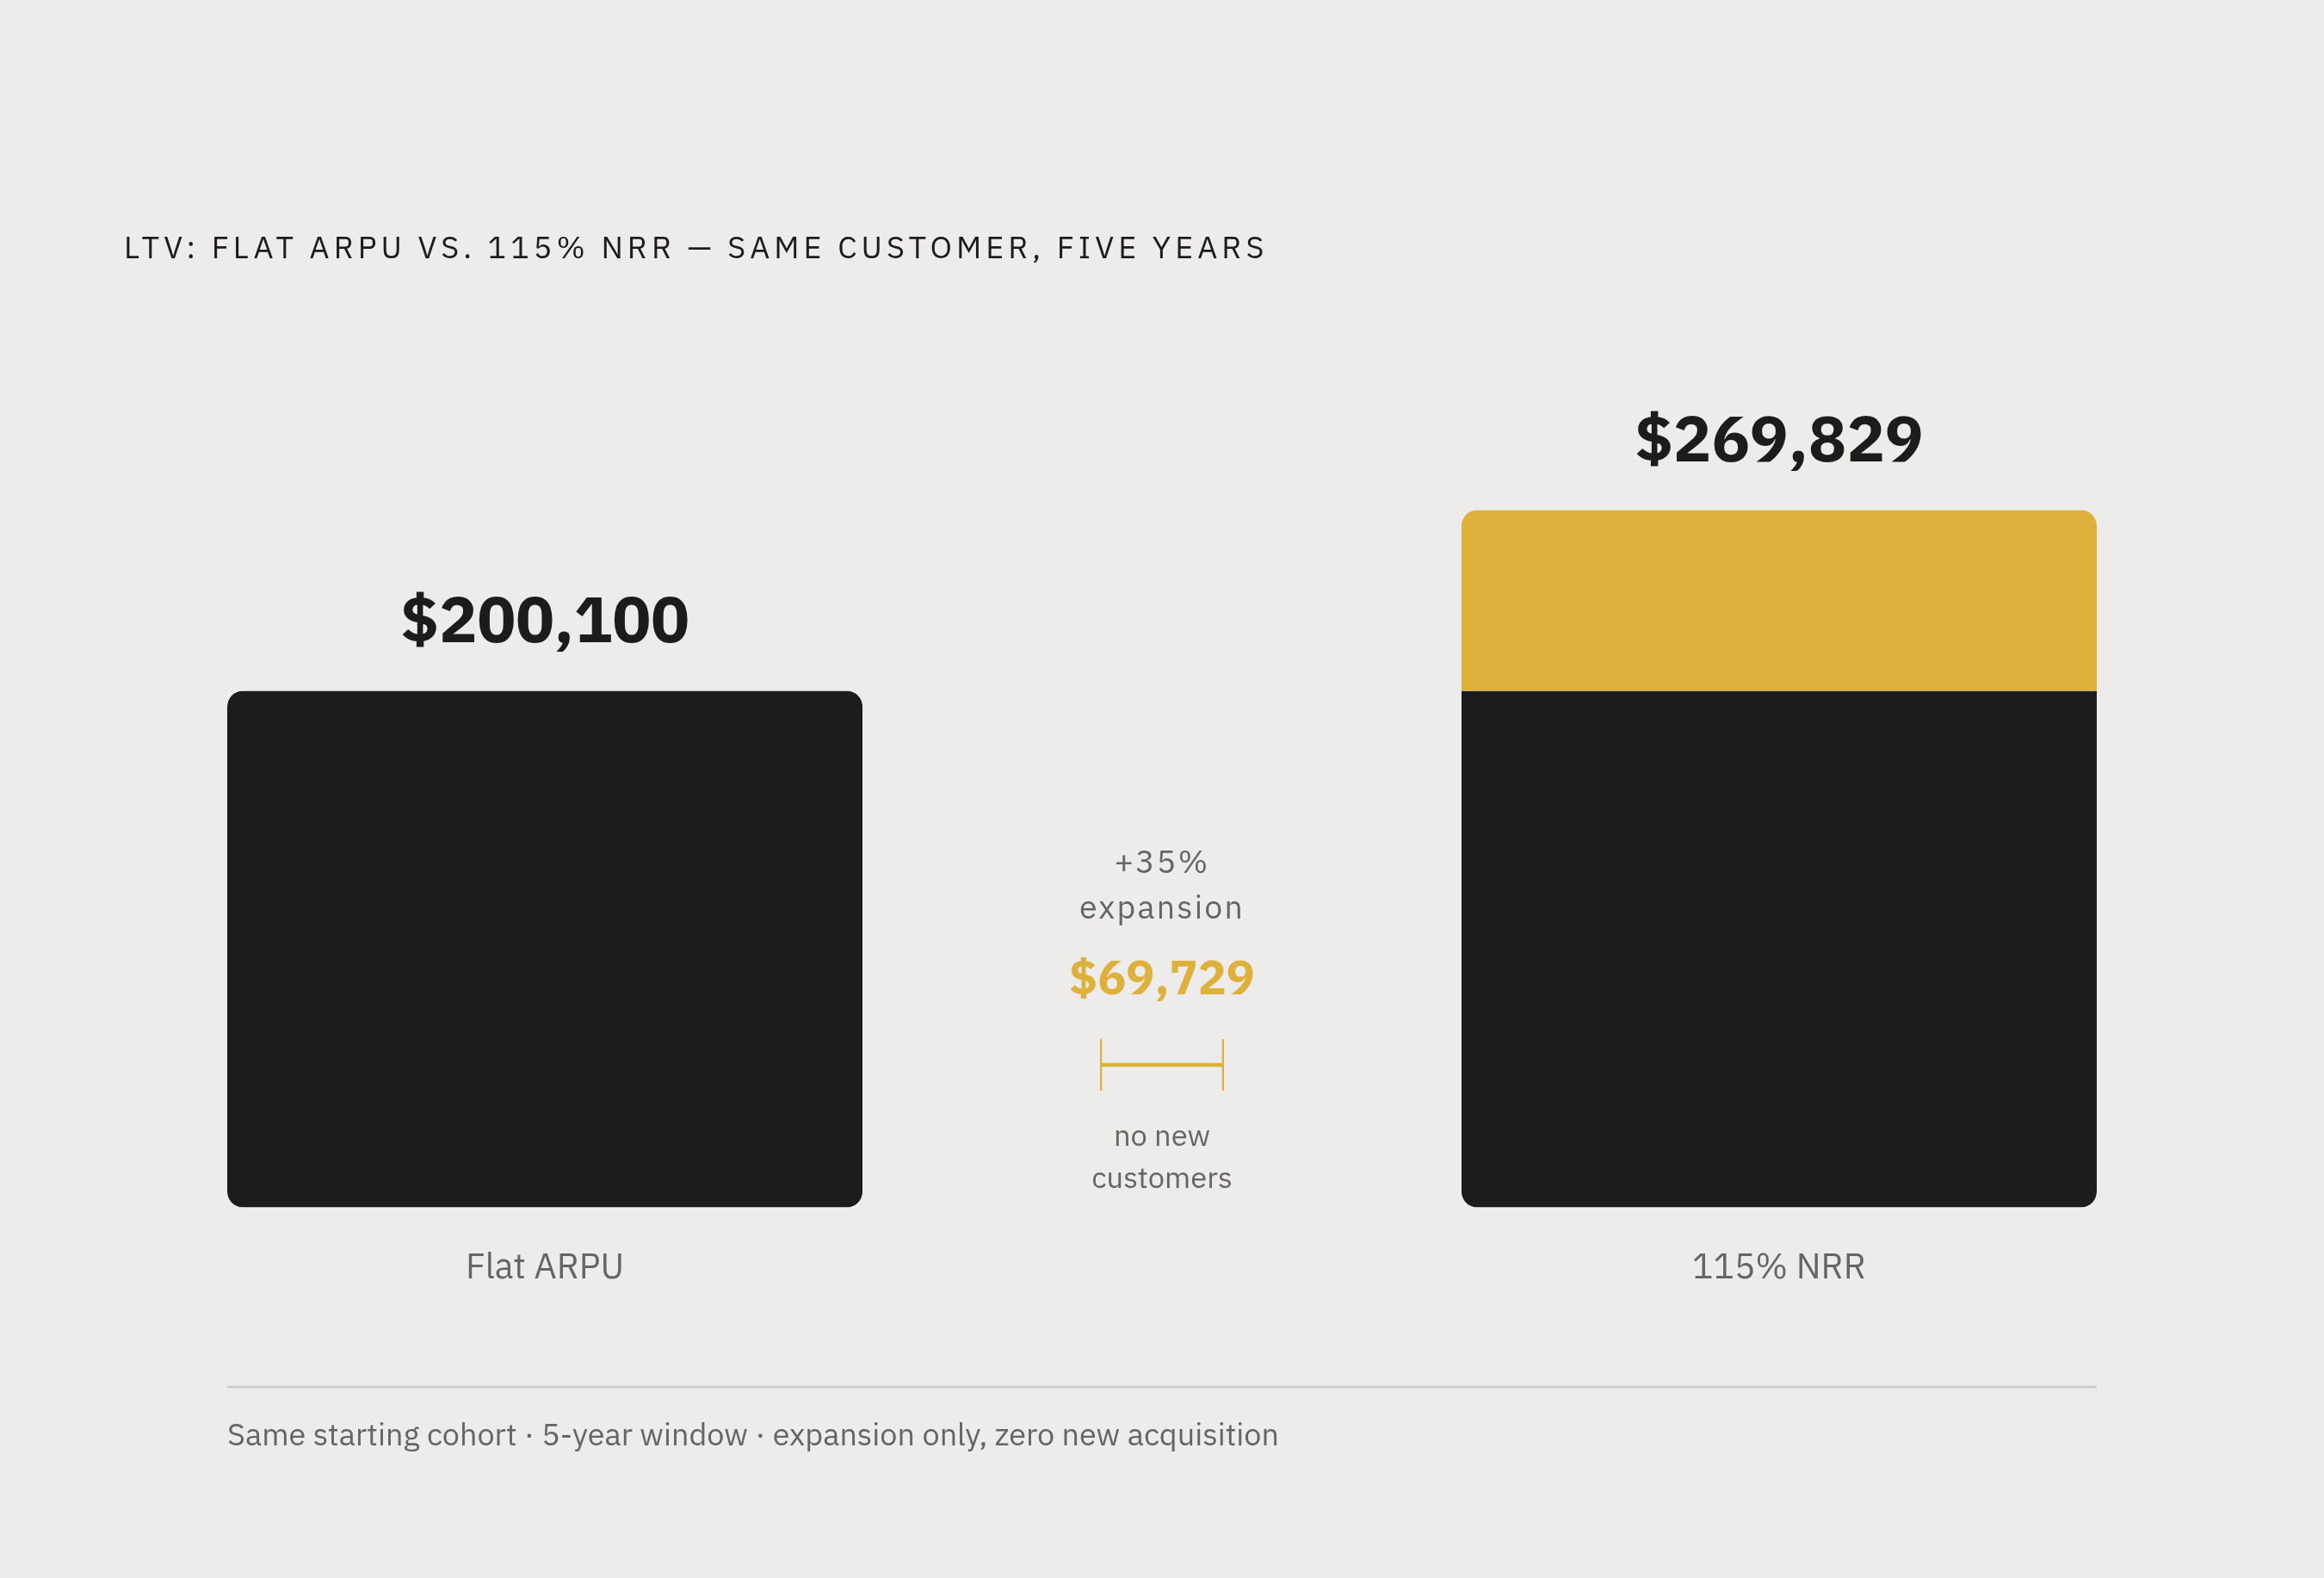
B2B SaaS customers grow. Seats get added. Usage climbs. Somebody upsells them into a bigger tier. Net revenue retention above 100% is common across a large chunk of this market. And the standard formula handles most of that growth by... ignoring it completely. Flat ARPU, fixed lifespan, no expansion, as if every account is frozen the day they sign.
Here's what that costs you in real numbers. A five-year LTV calculated with flat ARPU comes out to roughly $200,100. Run the same customer at 115% NRR instead, and it jumps to about $269,829. That's a 35% gap, and not one new customer was acquired to get it. That's just existing accounts growing the way they actually grow.
But it gets weirder than "the number is a little low." The textbook fix for expansion tells you to divide by "gross churn minus expansion rate." Once NRR crosses 100%, that denominator goes negative. A negative denominator means the formula spits out infinite LTV, which is, technically, math. It is also largely useless for running a business, because no customer is worth infinity dollars, and if your spreadsheet says otherwise, your spreadsheet is likely broken.
So instead of solving for infinity, cap the horizon:
- Five years for Enterprise
- Three years for SMB
- Sum expected revenue per year at your assumed NRR, then apply gross margin on top
That turns an unsolvable equation into a number you can actually plan a budget around. And once you've got it, it should change how you think about acquisition entirely: chasing the cheapest CAC isn't the same as chasing the best customer. A cheap customer who never expands might be worth less than an expensive one who doubles their contract by year two.
The operator's formula (what a rigorous LTV calculation actually looks like)
Okay, it's time to put this together. The goal here isn't precision for its own sake, it's a formula conservative enough that you'd actually trust it with a CAC decision, while still accounting for the three things the textbook version pretends don't exist.
LTV = (Annual Gross Profit per Account × Lifetime Cap in Years) × (NRR ^ (Years ÷ 2))
Let's take it apart:
- Annual Gross Profit per Account. ACV minus every real cost of serving that account. This is the margin fix from earlier, baked directly into the formula instead of quietly skipped.
- Lifetime Cap. A fixed number of years, not an infinity solve. Five for Enterprise, three for SMB. It's roughly how investors and acquirers already think about the number, so it's not an arbitrary choice, it's a familiar one.
- NRR exponent. This is what lets expansion (or contraction) show up without breaking the math. Accounts that grow push the number up. Accounts that shrink pull it down, with no infinity and no negative denominators.
None of this requires predicting exactly when any one customer will churn. The cap handles the horizon. The cohort data handles the early-churn skew. You're going for accuracy on average, across a segment, not a crystal ball for individuals.
One thing to watch for, because it's an easy mistake to make and a costly one: mixing annual and monthly units in the same formula. Multiply an annual churn rate against a monthly ARPU, or the other way around, and the error can come out around 12x. Not 12%, but roughly twelve times over. Work entirely in annual terms, start to finish, and this problem tends to disappear on its own.
Do you need all of this? If you're 80%+ gross margin, light on services overhead, and early stage, probably not, the simple version won't hurt you much. Below 80% margin, services-heavy, or with real expansion revenue in the mix, the full formula stops being optional. It's the floor you should be building on.
Segmented LTV (why a blended number hides the decisions that matter)
Quick question: what does a company-wide LTV:CAC of 4.0 actually tell you? Less than you'd think. It could be one segment at 8.0 and another at 1.5, with the strong one quietly propping up the one that's losing money. A blended number is, almost by design, a good place to hide a problem you badly need to see.
Worth cutting the data by:
- Company size. SMB, mid-market, and Enterprise churn differently, expand differently, and cost different amounts to acquire. Treating them as one customer type is the mistake.
- Industry vertical. Some verticals are sticky and expand on their own. Others churn at a rate that would set off alarms if you ever actually isolated it.
- Acquisition channel. Customers from different channels often carry very different retention behavior, even if the initial CAC looks similar.
- Contract type or ACV band. Annual versus monthly, low-ACV versus high-ACV. These aren't just billing details, they're different businesses wearing the same logo.
Once you segment, you can set CAC targets by segment instead of against one flattened average. That's the difference between a reporting exercise and an actual decision about where the next acquisition dollar goes.
A rough real-world anchor: Series A B2B SaaS companies with ACV in the $20K-$80K range show median CLV somewhere between $60K and $300K, and much of that spread comes down to retention. Same stage, same rough deal size, wildly different outcomes depending on what happens after the contract's signed.
A segment-by-segment LTV:CAC table tends to beat a single company-wide number whenever it actually matters, which is most of the time.
LTV:CAC as the actual operating metric (what the ratio means at different levels)
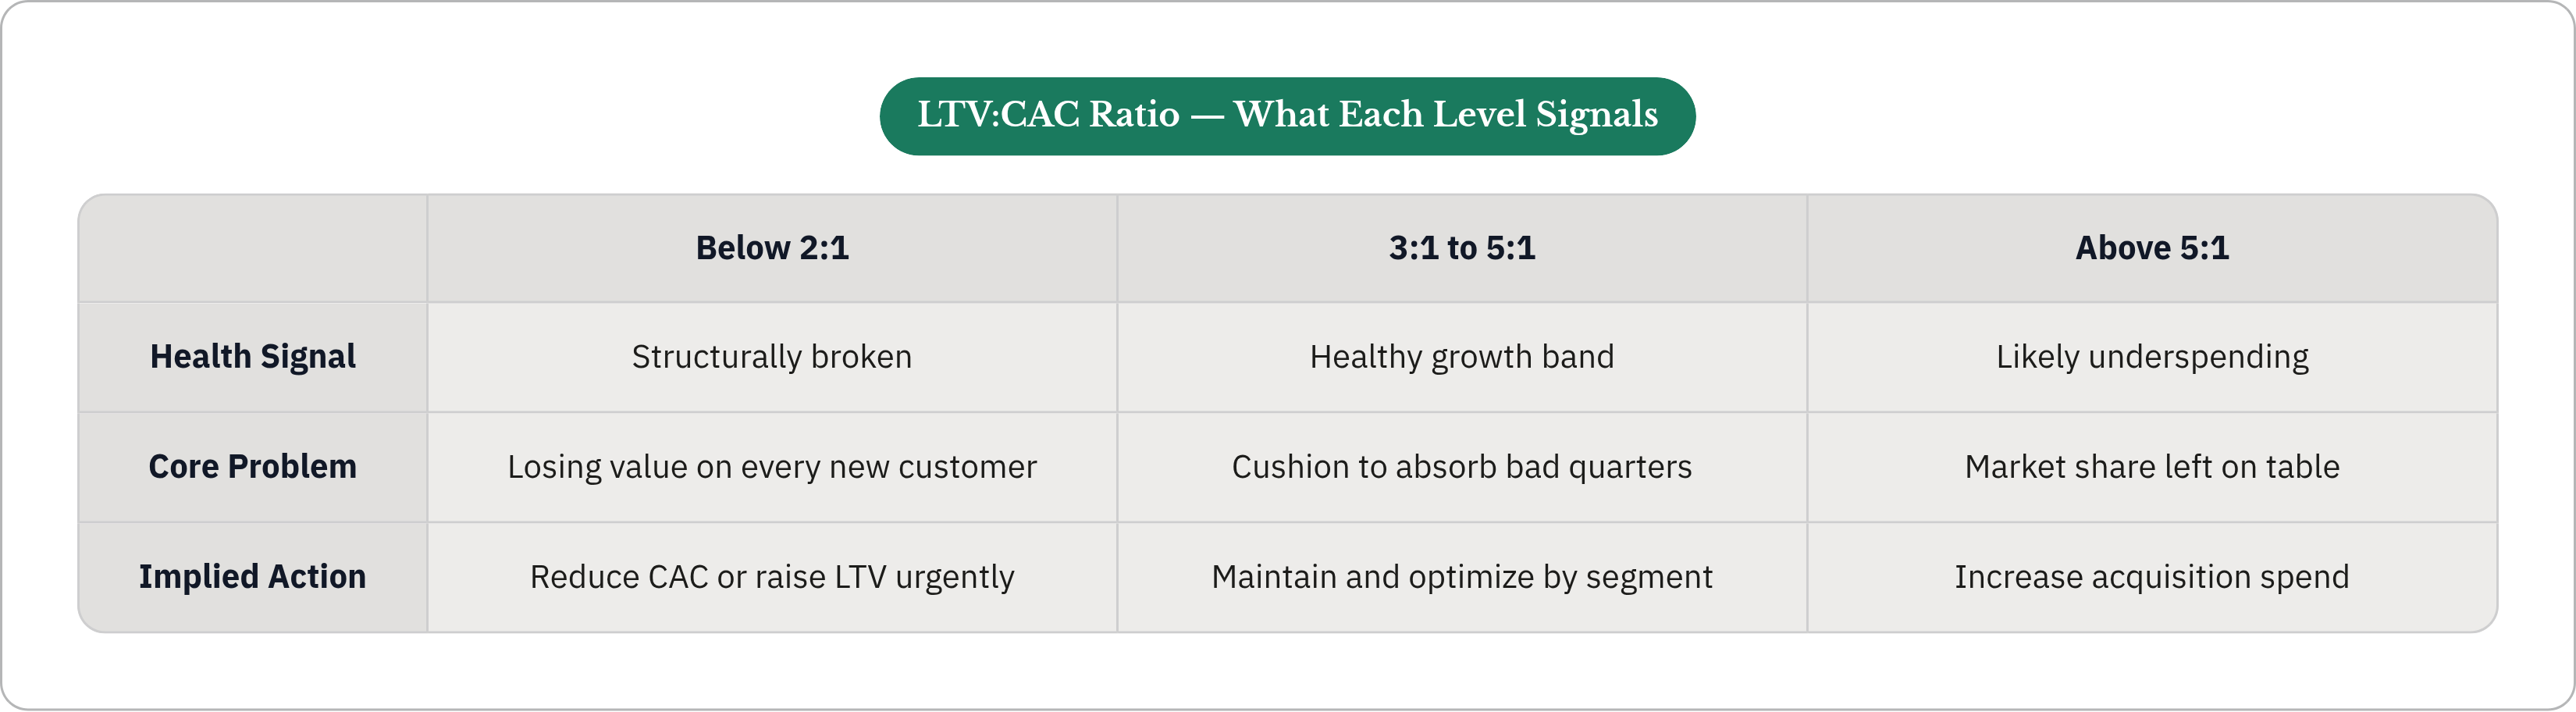
Everyone's heard the 3:1 rule: three dollars back for every dollar spent acquiring the customer. But the ratio alone doesn't tell you much until you know where you land on it:
- Below 2:1. Something's structurally off. CAC's too high, LTV's too low, or both, and you're losing value on every new customer you bring in.
- 3:1 to 5:1. This is the healthy band. Enough cushion to fund growth and absorb some bad quarters without a fire drill.
- Above 5:1. Probably a sign you're underspending. If the ratio's that comfortable, you're likely leaving market share sitting on the table out of excess caution.
For scale-stage B2B SaaS heading into 2026, median LTV:CAC sits around 3.8:1, and CAC itself has been climbing, averaging $1,200-$2,000 per customer, up roughly 14% year over year as more companies chase the same buyers.
The ratio alone isn't the whole story, though. Payback period matters just as much. Most B2B SaaS needs 12 to 18 months to recover CAC. A 3:1 ratio on a 24-month payback is a completely different cash situation than the same 3:1 on a 12-month payback. One's patient capital, while the other can turn into a cash crunch if growth slows even a little.
And here's the uncomfortable part: if the standard formula was overstating LTV by 20-40%, every ratio calculated off that formula has likely been too rosy. Companies have been setting CAC budgets against a healthier-looking number than the one that was actually true, which is a fine way to fund growth you can't really afford and not notice until things slow down and nobody can say exactly why.
Fixing the number doesn't automatically mean spending less, to be clear. It means spending on the segments that actually earn it, at prices you can defend with real math.
Where the calculation breaks down operationally (data, tooling, and the spreadsheet trap)
Most of this stuff still lives in spreadsheets. Improvado's research puts the number at 67% of B2B SaaS teams still calculating LTV that way. Spreadsheets aren't the enemy here, they're fine for plenty of things, but for this particular job they tend to fail the same three ways over and over:
- Stale data. The calculation's running on last quarter's churn and pricing while the actual business has already moved somewhere else.
- Double-counting. Expansion revenue gets pulled into more than one report and quietly inflates the total.
- Hidden costs. CS overhead and per-account infrastructure never get allocated back to the account, so gross profit looks better on paper than it is in reality.
Improvado also found teams burning 30+ hours a month manually keeping these numbers current. That's roughly the point where it's cheaper to build something automated than to keep paying someone to babysit a spreadsheet.
A rough guide, not gospel:
- Under ~$2M ARR. Simple dashboards, monthly refresh, manual cohort tracking. Perfectly fine up to a few hundred customers.
- $2M-$10M ARR. Time to automate channel attribution. Once someone's spending 20+ hours a month hand-assembling this, that's your signal.
- $10M+ ARR. Real-time dashboards make sense here. At this size the number is consequential enough day to day that stale data becomes a real operating risk, not just an annoyance.
None of this matters, though, if the inputs feeding the formula are bad. Most teams are missing:
- Cohort start dates, so early churn can be tracked at all
- Per-account cost of revenue, so the margin step is real instead of a guess
- Expansion revenue by account, so NRR gets calculated at the cohort level instead of estimated company-wide
You don't need expensive tooling to fix this. What you need is clean inputs. The tooling itself is the easy part.
What a corrected LTV number actually changes in growth investment decisions
At the end of the day, LTV's job is simple: it sets the ceiling on what's rational to spend acquiring a customer. Get that ceiling wrong and every decision built on top of it inherits the mistake.
Once the number's actually right, three things shift:
- CAC targets by segment, instead of one blended figure that flattens every meaningful difference between customer types.
- Channel allocation. If a channel produces customers with higher early churn or weaker expansion, the corrected LTV shows that channel's real cost is higher than the reported cost-per-acquisition ever let on.
- Onboarding investment. If 40% of churn sits in the first 90 days, money spent fixing onboarding is functionally an LTV improvement, not a CS line item sitting in a separate budget where nobody connects it back to acquisition math.
There's a longer-term payoff too. A company tracking LTV at the cohort and segment level, quarter after quarter, builds a real record: which customers expand, which channels actually produce them, which onboarding paths cut down on early churn. Every future campaign decision starts from that history instead of a guess.
And this is where it gets genuinely useful, not just accurate. CAC is the half of the ratio you can actually steer, through who paid media targets, which company sizes, which verticals, which job titles. If the data says a segment expands reliably and rarely churns, that's not a footnote for the customer success team to file away. That's a targeting brief for whoever's running acquisition.
Getting the formula right was never really about having a cleaner number to put in a deck. It's about knowing, with real confidence, where the next dollar should go before you spend it instead of after.