MQL to SQL Conversion Rate Benchmarks for B2B
The 13% to 40% gap in MQL-to-SQL benchmarks isn't a data problem—it's a definition problem.
MQL-to-SQL conversion rates for B2B companies range from 13% to over 40%, depending on which report lands on your desk. That's not a typo. It's two different metrics wearing the same name by accident, and it's what happens when an entire industry never sat down to agree on what "qualified" means.
If you've googled this benchmark and closed the tab more confused than when you opened it, welcome to the club. First Page Sage says 13%, based on client data from 2019 to 2025. Optifai says 40%+, based on 939 B2B companies tracked from Q2 2025 through Q1 2026. Both are real numbers. Neither one is lying to you.
So the instinct to go find "the real number" is the wrong instinct. There isn't one. The better question is: what is each source actually counting? Once you know that, the benchmarks stop being a trivia contest and start being something you can actually use on your own pipeline.
What MQL and SQL actually mean, and why nobody writes it down
Here's the part that never makes it into the slide deck: most companies don't have a shared definition of MQL and SQL between marketing and sales. Martal Group found that 68% of B2B organizations have no clearly defined, shared funnel stage definitions across the two teams. Two-thirds. That's not a gap, that's most of the industry just winging it and hoping the numbers line up.
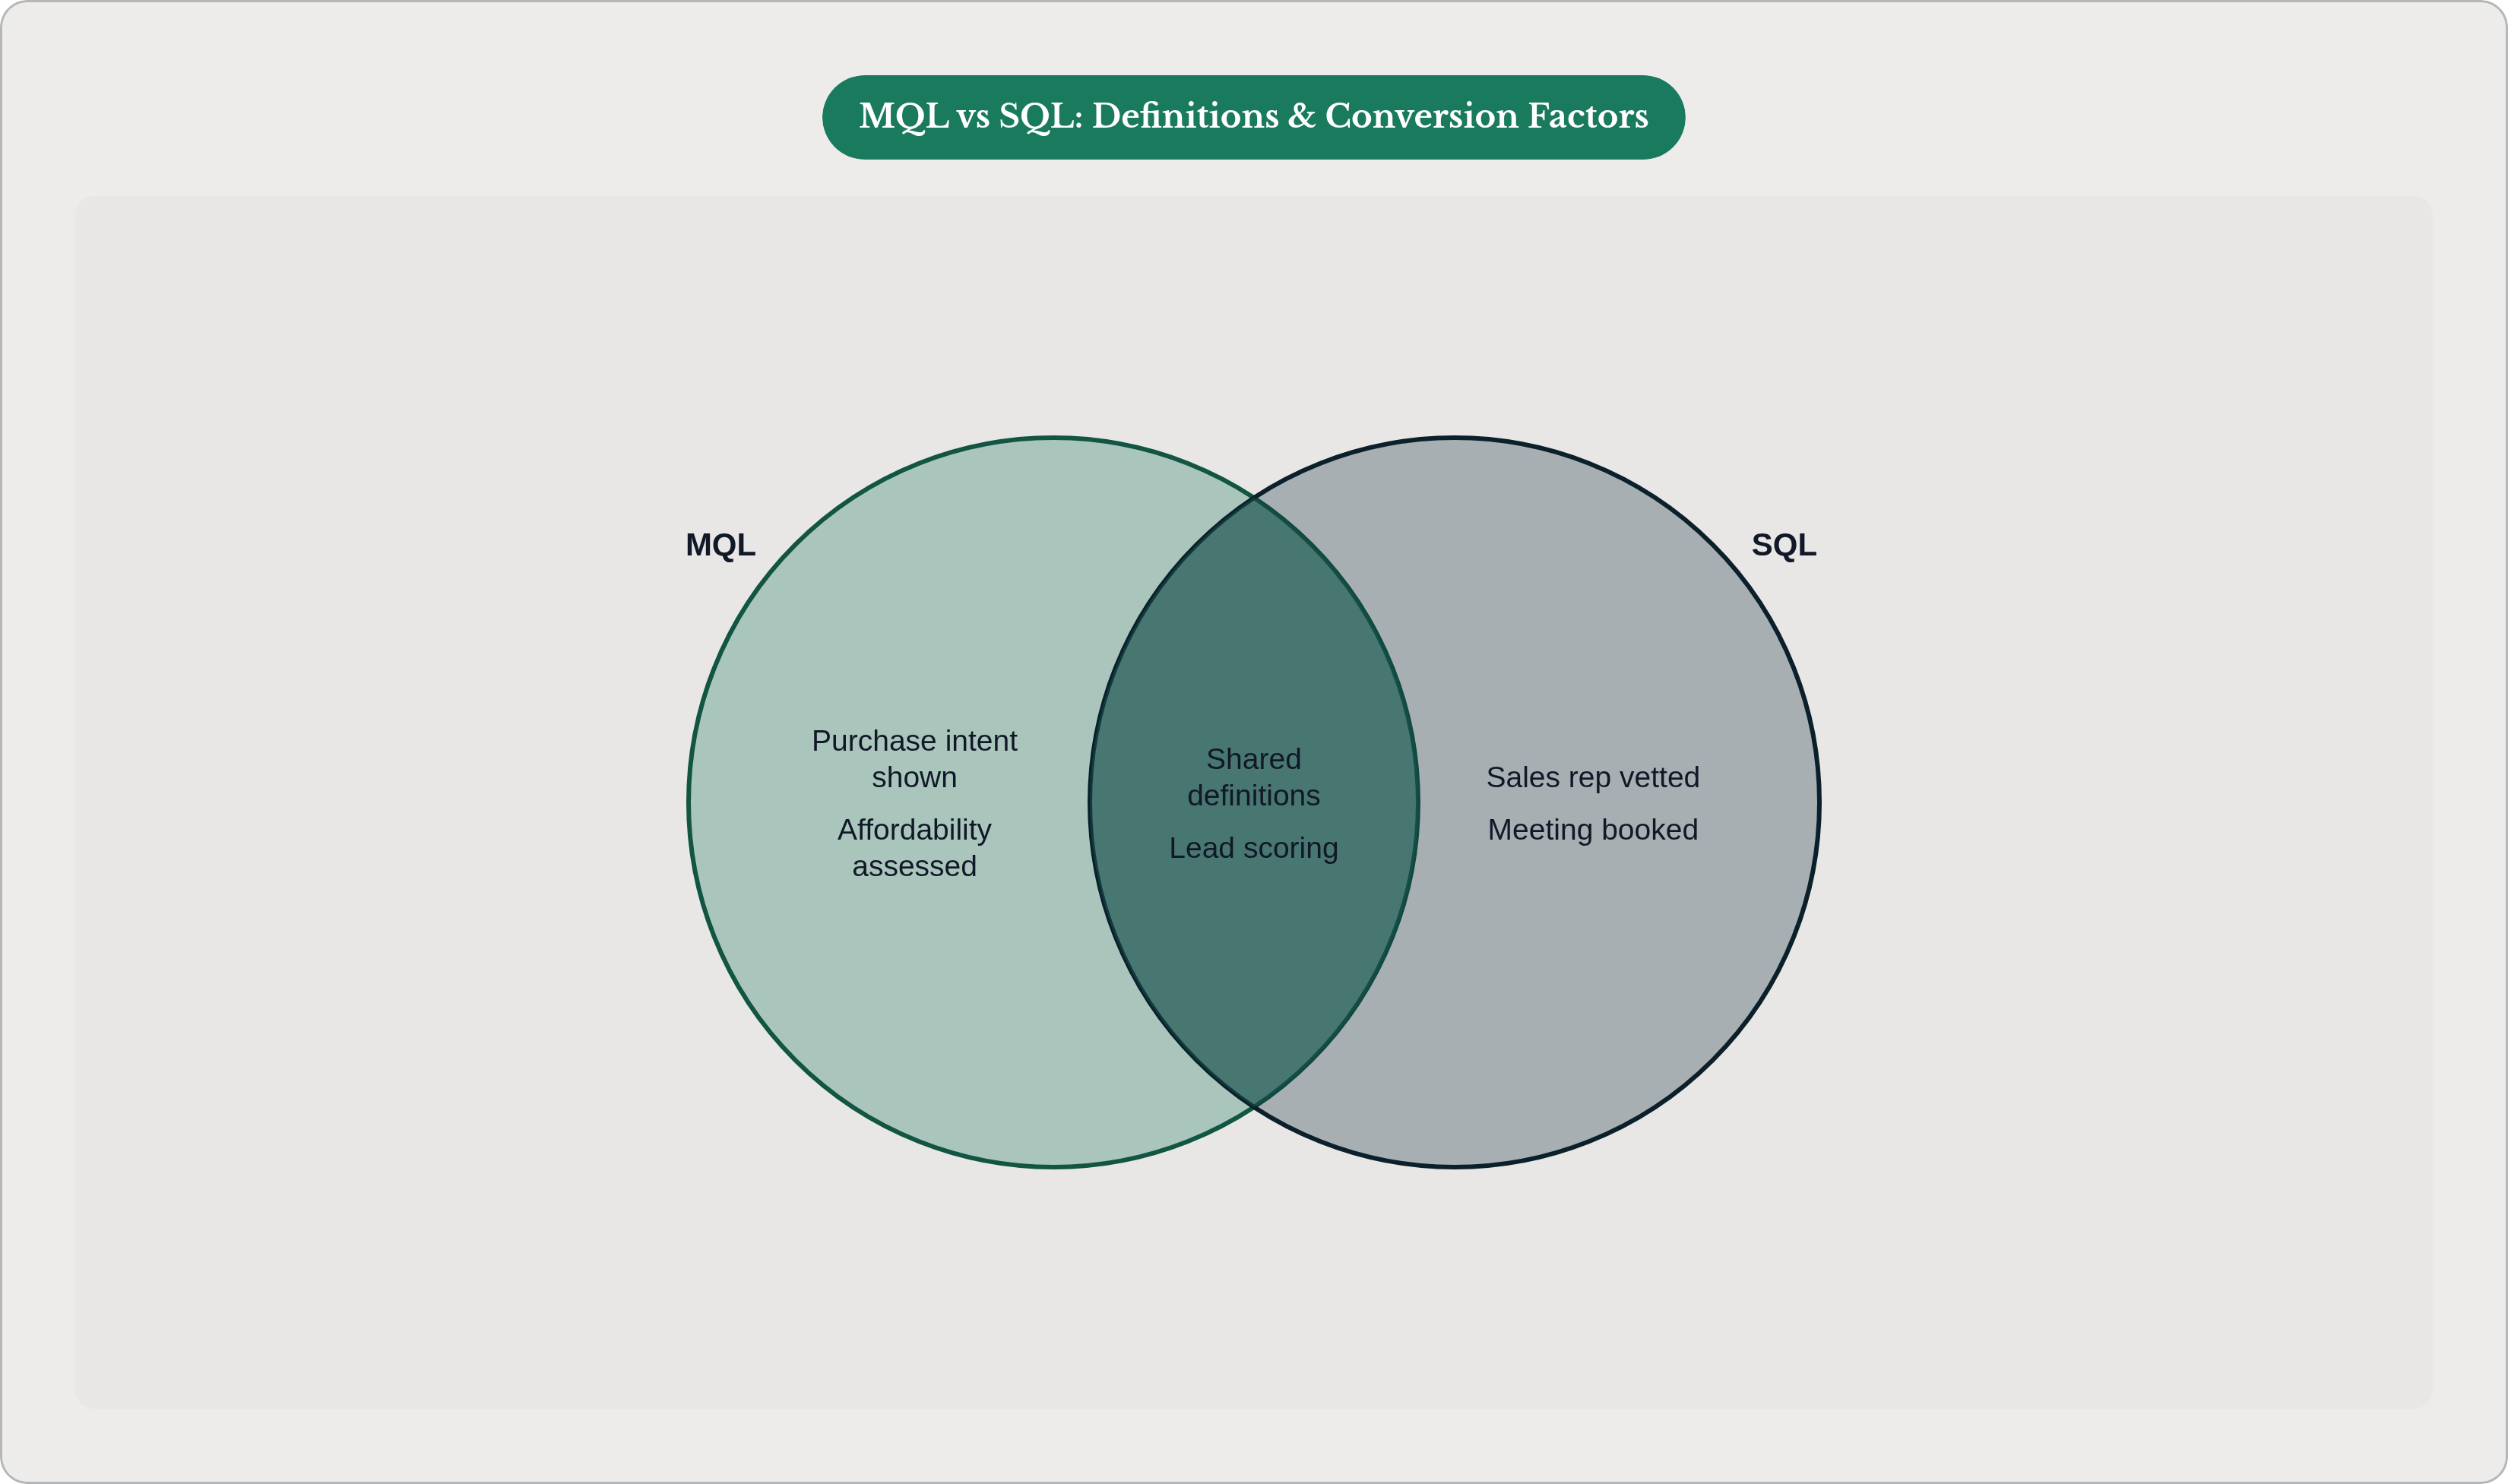
So let's actually define the terms, using one of the tighter versions out there (First Page Sage's):
- MQL: a contact who's shown purchase intent and been assessed as able to afford the product.
- SQL: that same contact, now passed to sales, vetted by a rep, and either met with or booked for a meeting.
Clean enough on paper. Now watch how fast it gets messy in practice:
- Is an MQL anyone who filled out a form, or only someone who showed real intent?
- Is an SQL "handed to sales," or "accepted by sales after review"?
- Are inbound and outbound leads pooled together, or counted separately?
- Do free-trial signups even count as MQLs?
Change one of those answers and your conversion rate can swing by double digits, with nothing about your actual marketing or sales performance changing at all. Two companies in the same industry can report 13% and 42% and both be telling the truth. They just drew the line in a different place.
So before you hold your number up next to anyone else's, do the boring homework first: map your definitions against theirs. That's the whole exercise, really.
The benchmark range by industry, and what it says about lead quality
Here's what the published numbers actually show.
Optifai's dataset, 939 B2B companies from Q2 2025 to Q1 2026, is one of the biggest and freshest samples out there. It puts the B2B average at 40%, with SaaS at 45%, Professional Services at 42%, and Manufacturing at 35%. The best performers in that dataset clear 60%.
First Page Sage, pulling from B2B SaaS clients over 2019 to 2025, lands at 13%. MarketJoy's pipeline data sits nearby: 12–18%.
What's going on? Probably this: a stricter MQL definition filters harder before the handoff to sales. Fewer leads earn the MQL label, but the ones that do are more likely to convert. A looser definition waves more leads through the door, so the downstream conversion rate naturally looks worse, even if the total number of SQLs coming out the other end is about the same.
Picture two companies. Company A only calls its hottest, most-vetted leads an MQL. Converting 13% of those to SQL might produce roughly the same number of sales-ready leads as Company B, who calls anyone who downloaded a whitepaper an MQL and converts 40% of them. Same output. Wildly different-looking scorecard.
That's why the raw percentage matters less than the volume of SQLs you're producing per dollar spent getting there. MarketJoy's broader funnel numbers back this up: Lead-to-MQL runs 20–25%, SQL-to-Opportunity runs 10–12%, Closed-Won lands at 6–9%. MQL-to-SQL is one leak point among several. It's not the whole story, and treating it like it is will send you chasing the wrong fix.
How the channel shapes the number before sales ever touches it
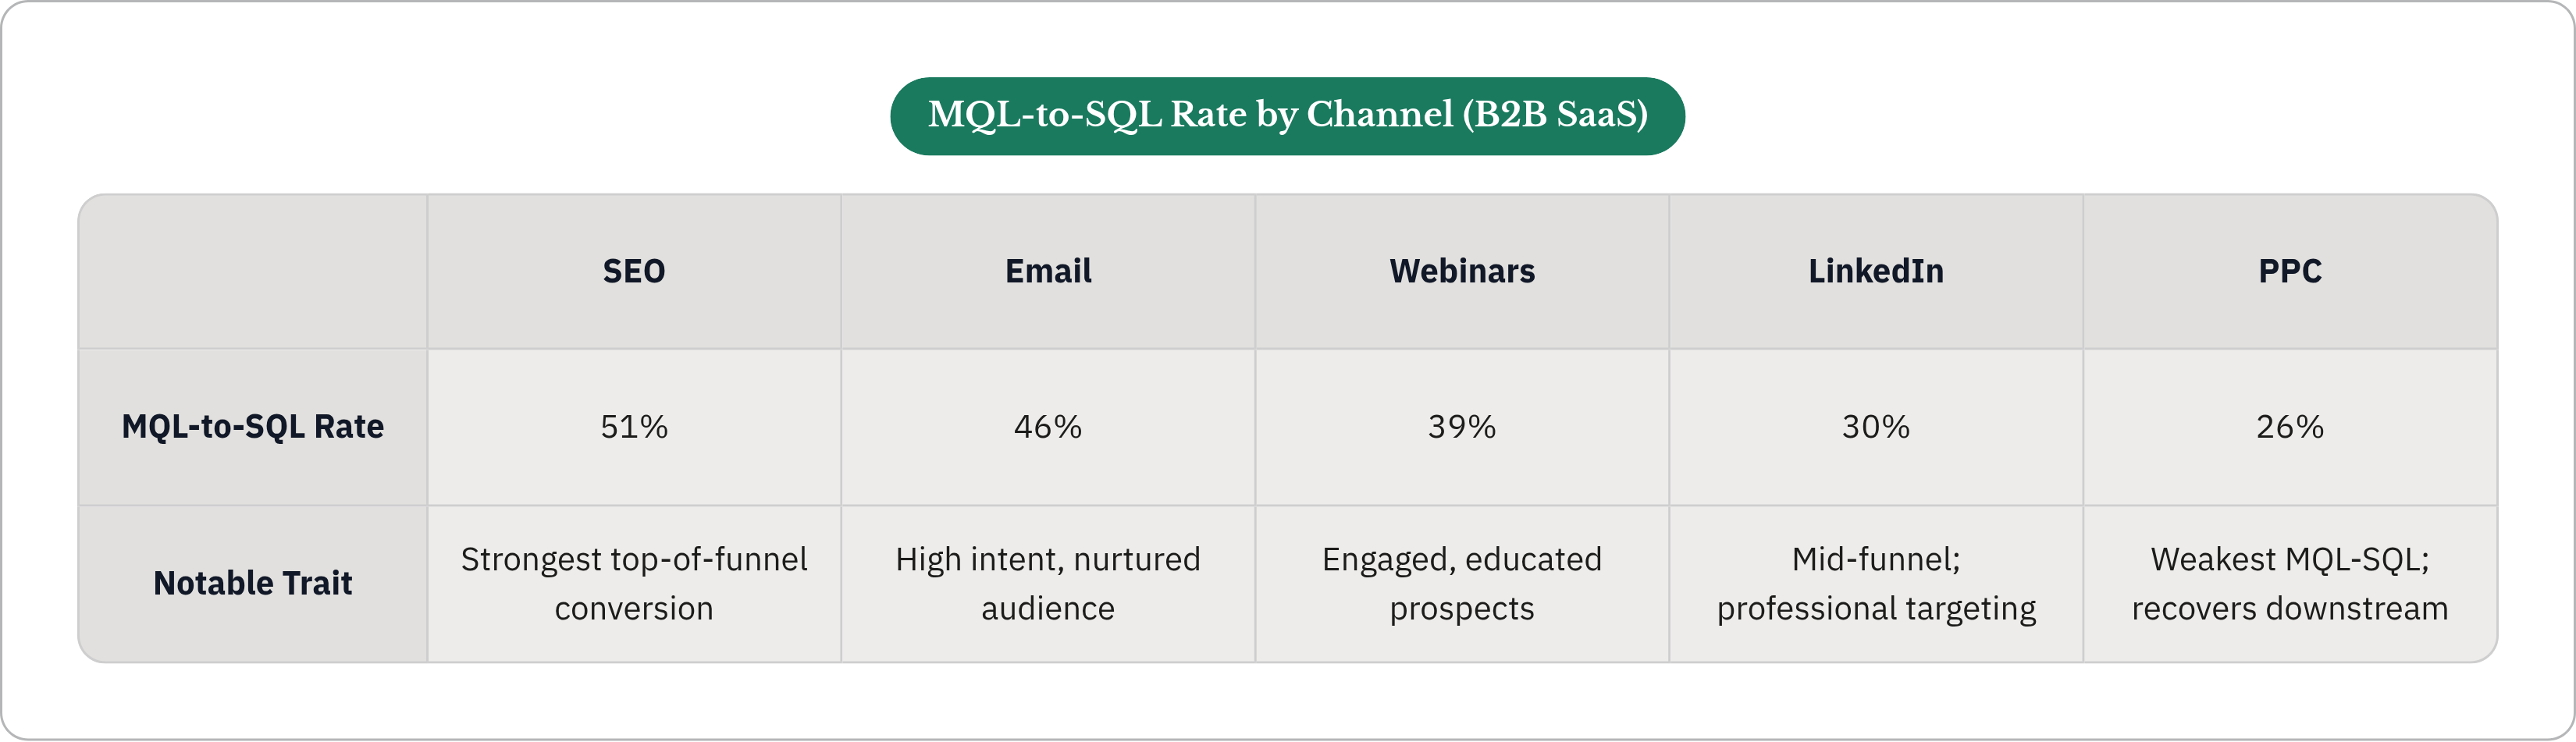
Before sales even gets a hand on a lead, the channel it arrived through has already decided a lot of the outcome.
First Page Sage's channel breakdown for B2B SaaS (June 2025): SEO converts at 51%, email at 46%, webinars at 39%, LinkedIn at 30%, PPC at 26%. That's a 25-point spread from channel alone, before any scoring model or sales SLA gets involved.
PPC is worth stopping on. It's got the weakest MQL-to-SQL rate on that list (26%), and per The Digital Bloom, one of the weaker visitor-to-lead rates too, at just 0.7%. Read those two numbers together and PPC looks like the obvious channel to kill.
But here's the twist: PPC tends to recover further downstream, with stronger opportunity-to-close rates later in the funnel. A weak MQL-to-SQL number doesn't make PPC a bad investment. It means those leads convert well at a different point in the journey than SEO or email leads do. Comparing PPC's MQL-to-SQL rate straight up against SEO's is like comparing a sprinter's mile time to a marathoner's. Different race.
So if you're running a multi-channel program, a single blended MQL-to-SQL number is actively hiding the thing you need to see. Not tracking conversion by source is like diagnosing a fever without checking which organ's inflamed. You know something's wrong. You have no idea what to treat.
Where in the funnel this number matters most
Zoom out to the full funnel. About 2.3% of website visitors become leads. Roughly 31% of those reach MQL status. MQL-to-SQL averages 15–21% in 2025 B2B SaaS data. SQLs convert to opportunity at 38–49%, depending on channel. Opportunities close at roughly 22–30%.
Of all those stages, MQL-to-SQL is the one the benchmark data flags as the bottleneck. Improve it by 5 percentage points and revenue can lift by up to 18%, according to 2025 pipeline benchmark data. That makes it one of the highest-leverage stages in the whole funnel to fix.
But there's a catch, and it's an important one. That revenue lift only shows up if the definitions on both sides of the handoff stay put. If you "fix" your MQL-to-SQL rate by just loosening what counts as an SQL, letting weaker leads into the category, you haven't fixed anything. You've inflated a number on a dashboard while actual revenue sits exactly where it was.
Context downstream matters too. Enterprise deals close at a 31% opportunity-to-close rate versus 39% for SMBs. A team selling into enterprise accounts should expect more drop-off later in the funnel, no matter how clean the MQL-to-SQL handoff looks.
What scoring and response speed actually do to this number
Two things move this number more than anything else: how you score leads, and how fast you call them.
On scoring: B2B SaaS companies using behavioral scoring, tracking what a lead actually does instead of just who they are, hit 39–40% conversion. That beats basic demographic scoring by a wide margin. Push into AI-powered scoring and the gap opens further. Optifai's data has AI-powered scoring at 55% MQL-to-SQL against 35% for manual scoring. Twenty points, from the scoring method alone.
On speed: this is the number that should make you a little uncomfortable. Respond to a lead within 5 minutes and you roughly double your conversion rate, 60% versus 30% for responses that take an hour or more. An hour doesn't sound like much. It's the difference between a warm lead and a cold one.
These two levers don't work in isolation. Good scoring without fast follow-up just leaves value sitting in an inbox. A well-scored lead that waits two hours is a well-scored lead that's already gone cold. And fast follow-up on badly-scored leads just burns sales capacity chasing people who were never going to buy.
Neither lever tends to work if marketing and sales built it in separate rooms. A scoring model with no sales input on what "qualified" actually means creates friction at exactly the moment speed matters most, right at the handoff.
It doesn't help that buyers have changed the rules on us, either. Forrester found in 2024 that 83% of the B2B buying process now happens without any direct sales contact. Buyers check an average of 17 sources before they ever pick up the phone. By the time someone lands in your pipeline as an MQL, they may already be most of the way to a decision, which makes that first human response even more consequential, not less.
Treat your number like a symptom, not a scorecard
Your MQL-to-SQL rate is a symptom. It's not a grade. A benchmark tells you whether to worry. It doesn't tell you what's actually broken. For that, you have to run your own diagnosis.
Here's a sequence that actually works:
- Step 1: Confirm your MQL and SQL definitions are written down and shared between marketing and sales. If they're not, your rate is mostly measuring noise.
- Step 2: Break the number down by channel. A healthy-looking blended rate can be hiding one channel that's quietly falling apart.
- Step 3: Compare against a benchmark whose definitions you've actually read, not just a headline number you liked the look of.
- Step 4: Figure out if your real constraint is quality (scoring), volume (channel mix), or the handoff itself (speed and SLAs).
That last step is where the actual diagnosis happens. A few patterns worth watching for:
- Low MQL-to-SQL paired with a strong visitor-to-lead rate points to a qualification problem, not a traffic problem.
- High MQL-to-SQL paired with a weak SQL-to-opportunity rate points to a sales process or fit problem, not a marketing one.
- A rate that's slipping over time, with definitions held constant, points to shifting lead quality or a shift in channel mix.
This matters especially if you run paid media. PPC leads often show up with one of the weakest MQL-to-SQL rates of any channel. Judge the program by that number alone and you'll underinvest in a channel that's actually closing deals just fine, later than you expected to look for them.
Sometimes the real problem isn't even at this stage. It might be upstream: weak creative, a landing page pulling in the wrong crowd, or an attribution gap making the funnel look healthier, or sicker, than it really is. Finding the actual constraint beats optimizing whatever metric happens to be staring at you from the dashboard.
Teams running paid media as an ongoing program, one where each campaign leaves behind audience data, creative learnings, and funnel signal that compounds over time, are in a much better spot to run this diagnosis continuously. It becomes a running conversation with your own pipeline. Not a once-a-year benchmarking exercise you dread.