Google Ads Quality Score Impact on B2B Campaign Costs
Most B2B teams optimize ad copy while ignoring landing pages, the heavier Quality Score lever.
Most B2B advertisers spend the bulk of their optimization time on ad copy. Tweaking headlines. A/B testing CTAs. Debating whether "Schedule a Demo" outperforms "See It in Action."
That's not necessarily wrong. It's just that ad copy drives the component with the lowest weight in the Quality Score formula.
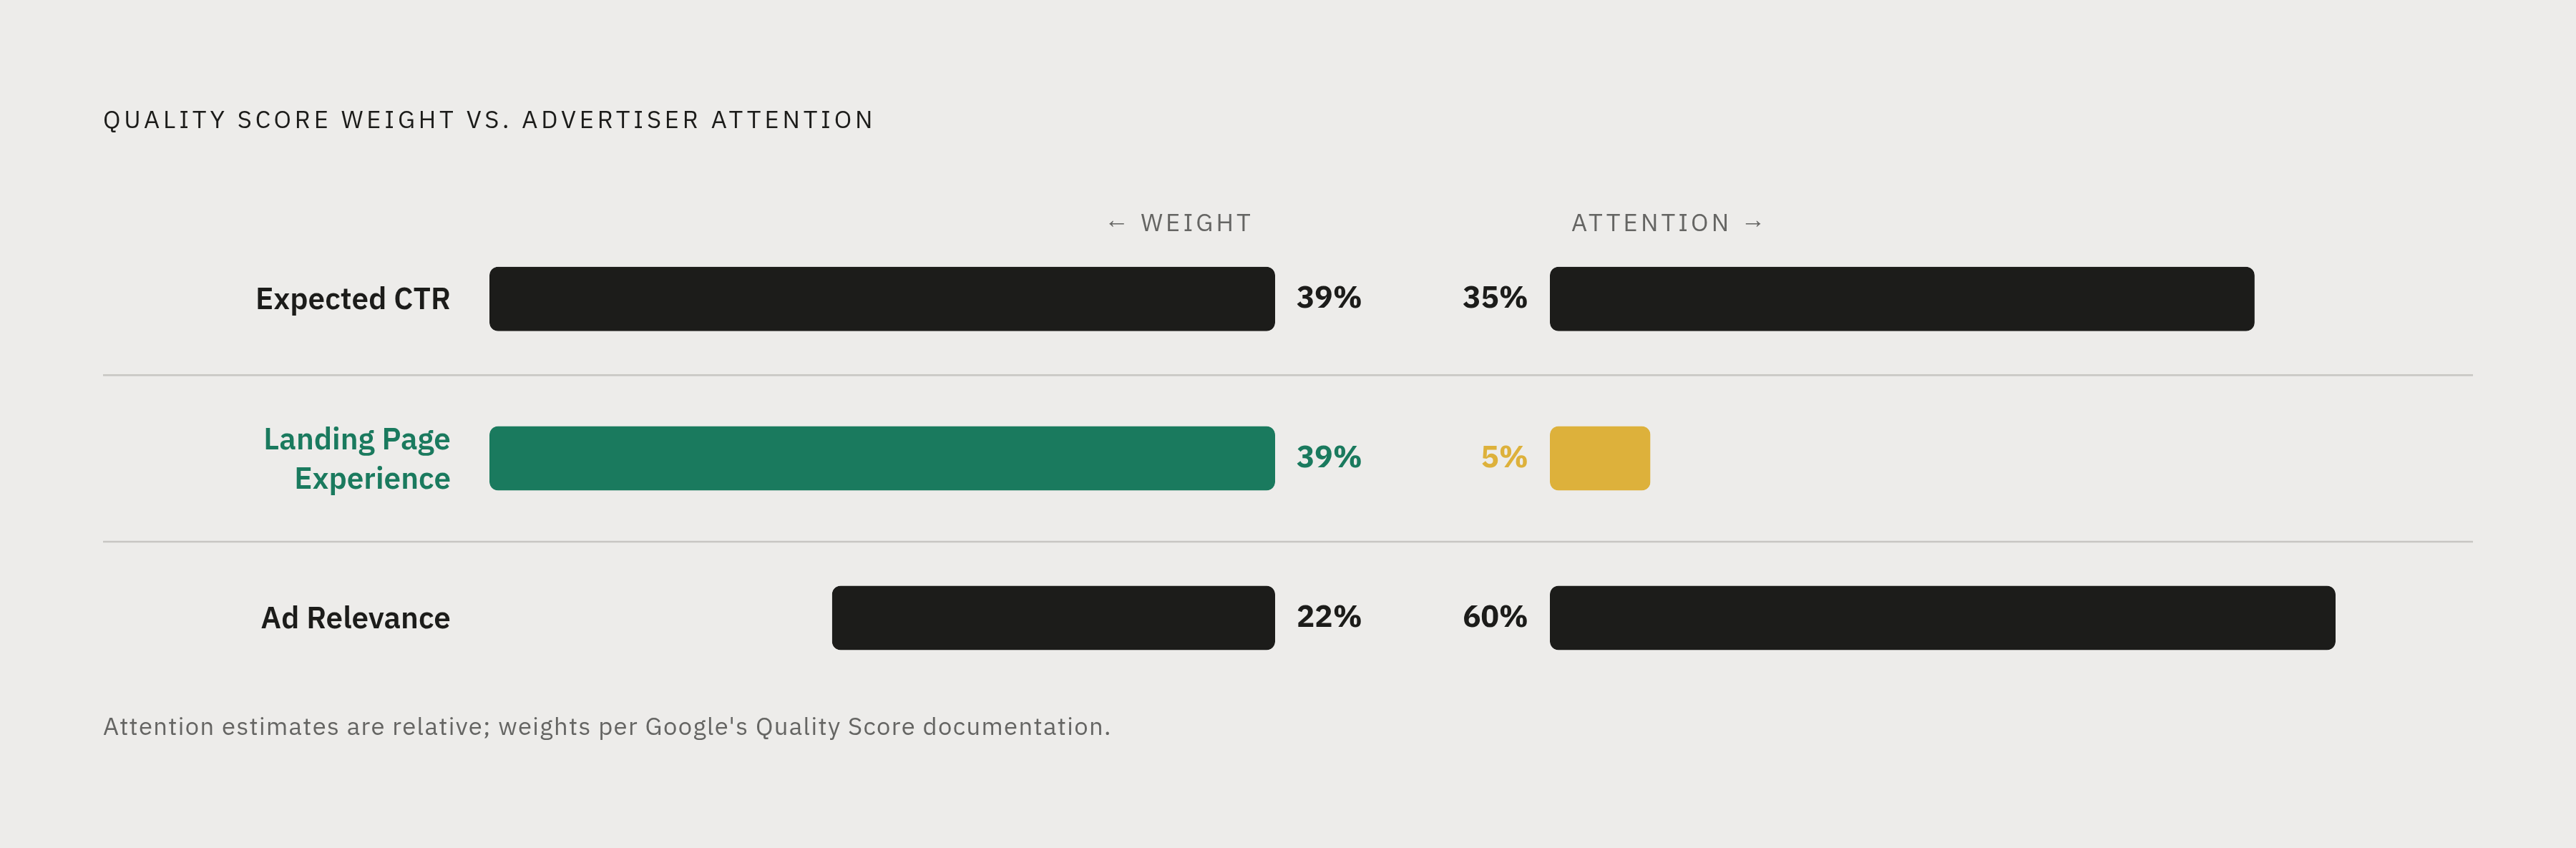
Per Adalysis's 2024 analysis, the three components break down roughly like this:
- Expected CTR: roughly a third or more
- Landing Page Experience: roughly a third or more
- Ad Relevance: ~22%
Landing page and CTR together account for about four-fifths of the score. Ad copy sits at the bottom.
Expected CTR is Google's prediction of how likely someone is to click your ad for a specific keyword, before any position adjustments. It's a forward-looking estimate based on historical signal patterns across the whole platform, not just your own account history.
Ad Relevance is about semantic alignment. Not keyword stuffing. Does your ad actually answer the intent behind the search?
Landing Page Experience is Google evaluating what happens after the click. Is the page relevant to the ad? Does it load fast? Does it work on mobile? Does it give the visitor what they came looking for?
The failure mode that shows up again and again in B2B accounts is remarkably consistent: teams build ads and pages around product categories. "Enterprise revenue intelligence platform." "AI-powered sales automation." Those describe what you sell. They don't answer what someone actually typed into Google.
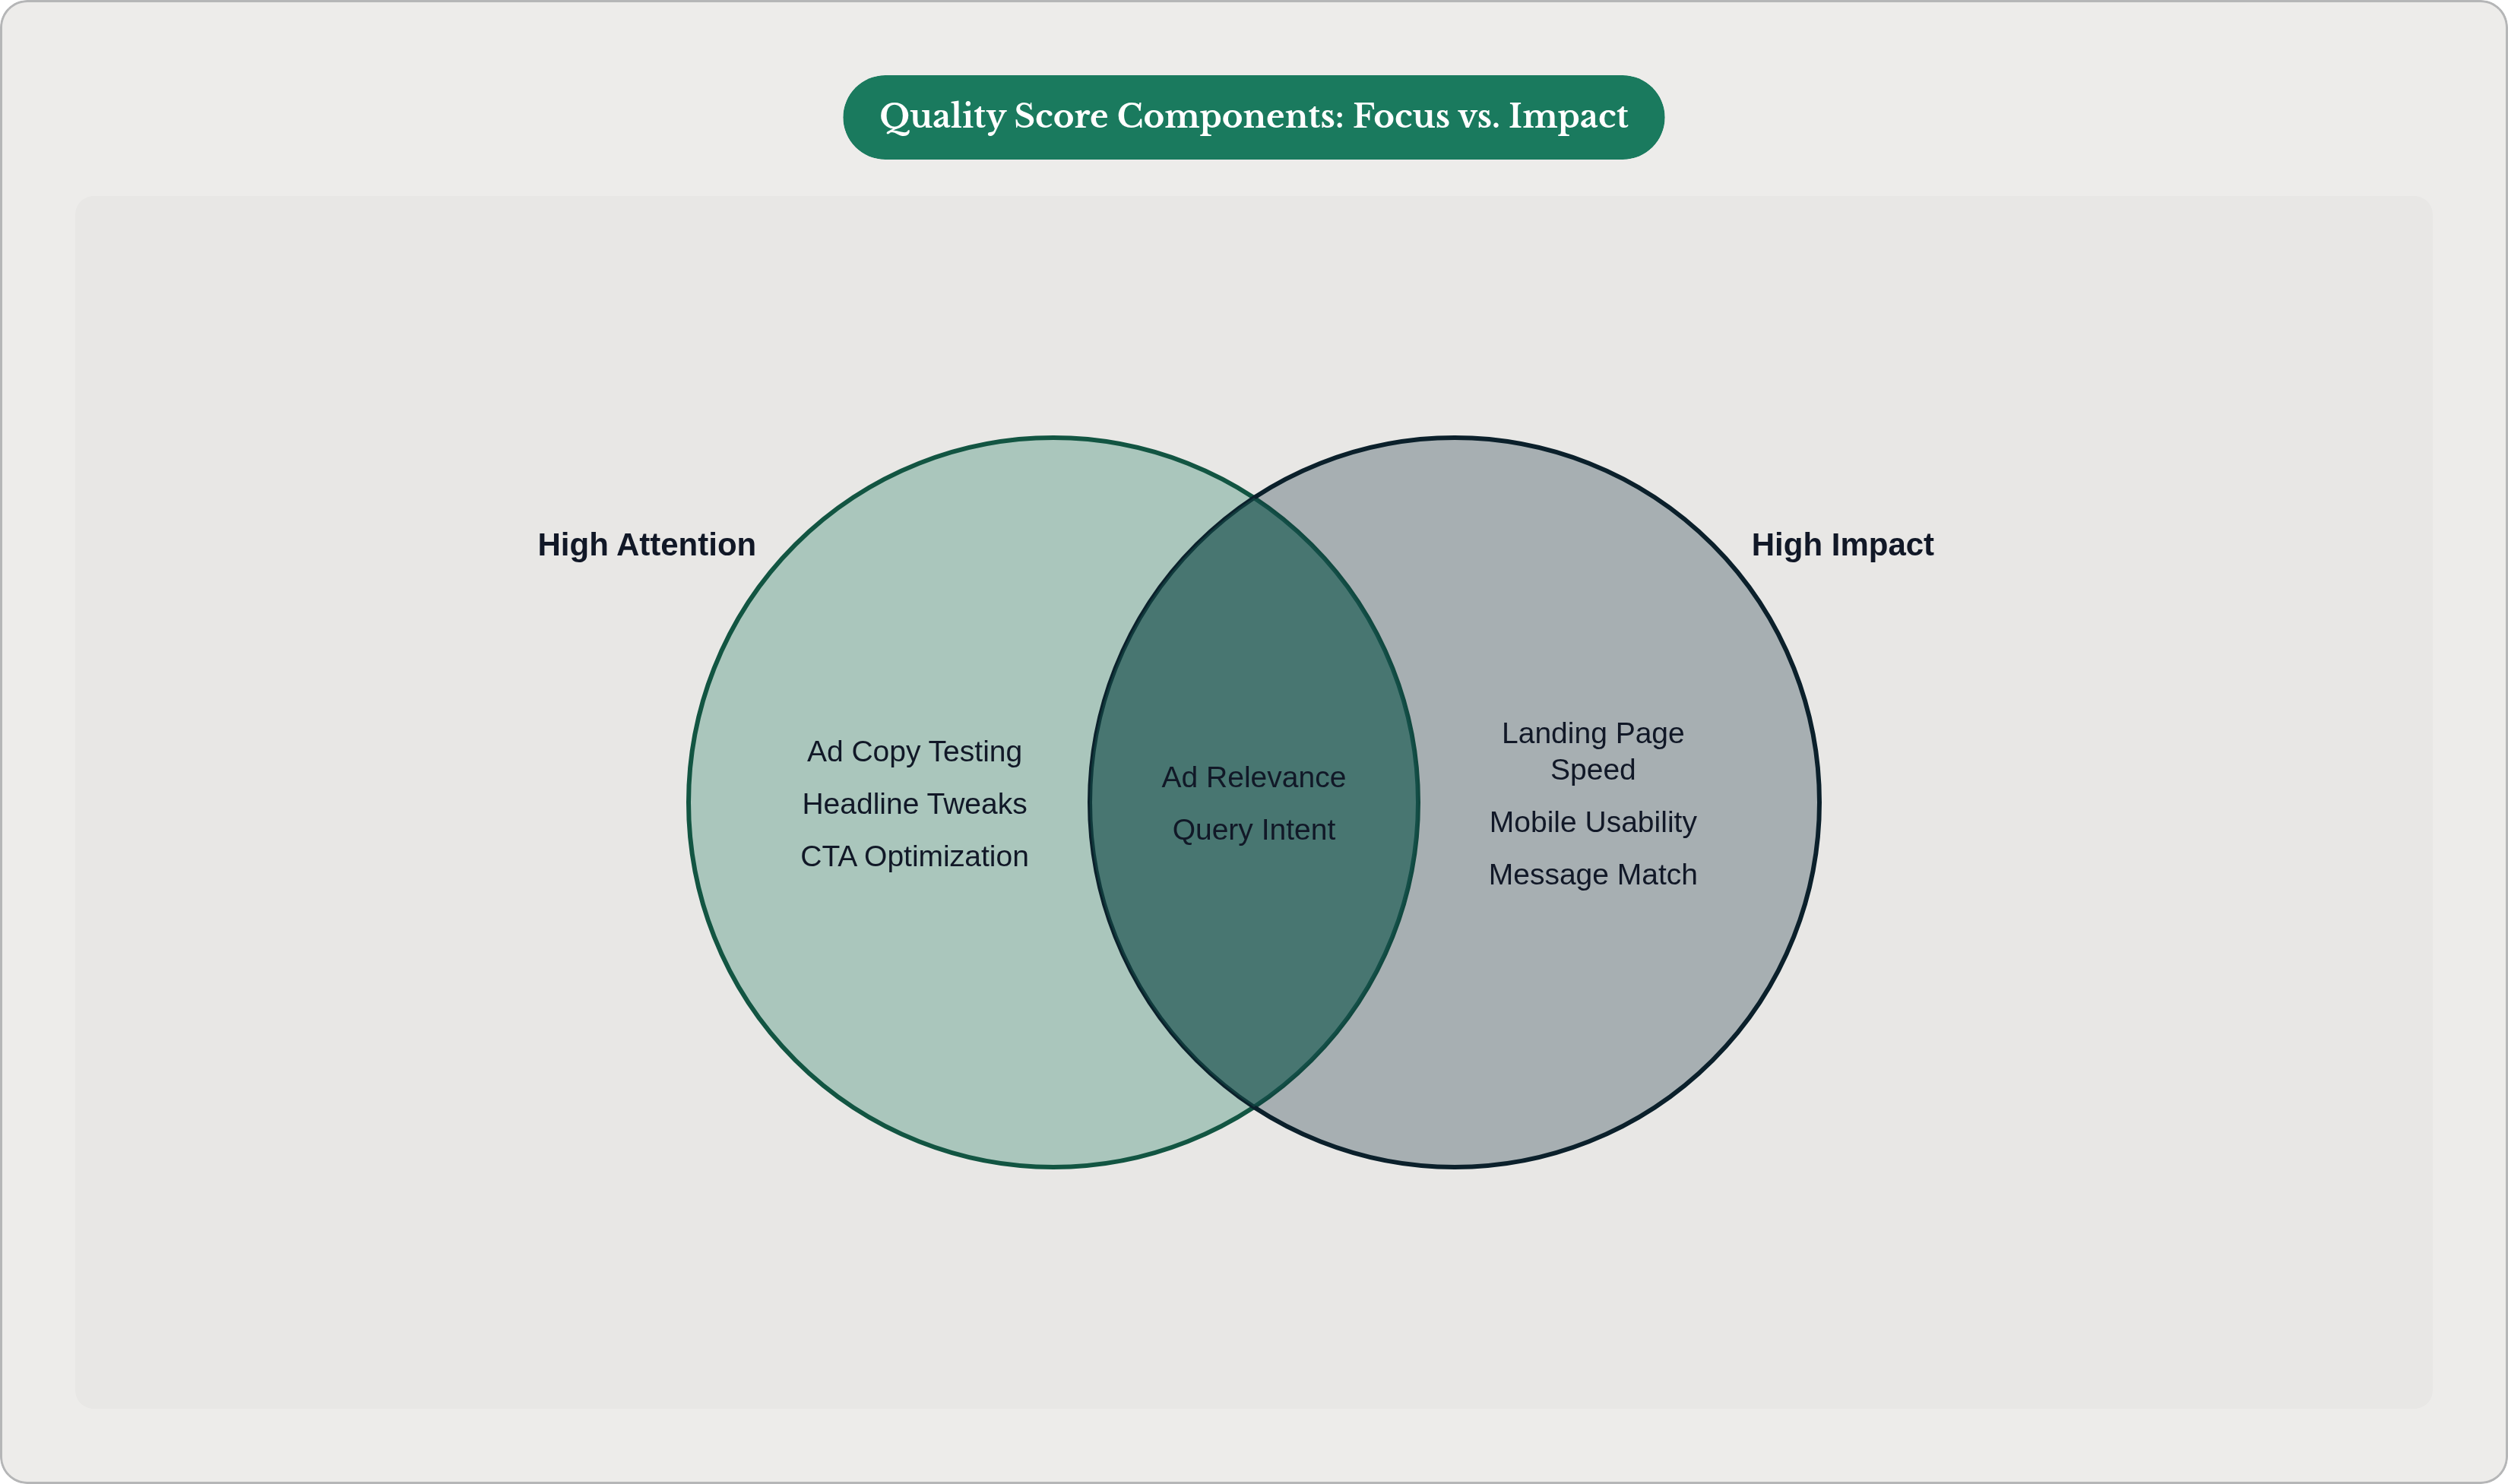
That framing misaligns all three components at once. The component getting almost no ongoing attention (landing pages) carries the same estimated weight as CTR. The component getting the most attention, ad copy, carries the least. Nobody consciously made that tradeoff — it's just where habit takes people, and it's a quietly expensive habit.
The Direct Relationship Between Quality Score and What You Actually Pay Per Click
This is where Quality Score stops being an abstract report card and starts being a budget conversation.
Your actual CPC approximates your competitor's Ad Rank divided by your Quality Score, plus one cent. Higher score means you pay less for the same position, or you get a better position for the same price. Lower score means you pay a premium. Think of it like a credit score for your ads — except the interest rate recalculates every single auction.
Why does Google build it this way? Because relevance is in Google's financial interest. Relevant ads get clicked more. More clicks per impression means more revenue. Better results for users means they keep coming back. It's one of the rare cases where the platform's incentives and the advertiser's incentives actually point in the same direction.
The practical translation, by score range:
- Scores 1 to 4: You're paying a meaningful premium on every click.
- Scores 5 to 6: Roughly neutral. You're near market rate.
- Scores 7 to 10: Progressively larger discounts.
Per modeling from LeadGen Economy, moving from a Quality Score of 5 to a Quality Score of 8 on lead generation keywords reduces cost per lead by approximately 27%. That's not a marginal tweak. That's a structural repricing of your demand generation budget.
And it compounds. Lower CPC at the same budget means more clicks. More clicks means more conversion opportunities. More conversion data means smarter automated bidding. The improvement doesn't stay contained to the keywords you fixed — it bleeds into how the whole campaign learns.
One thing worth flagging for teams running Performance Max: the equivalent mechanism there is asset group rating (Low, Good, or Best). Same structural logic, different format. The quality of your creative assets and how well they match audience signals determines both reach and what you effectively pay.
Where B2B SaaS Accounts Actually Score, and What the Gap Is Costing
WordStream's analysis of tens of thousands of Google Ads accounts in 2025 puts the industry-wide average Quality Score at 5 to 6. Anything at 7 or above puts you ahead of most advertisers.
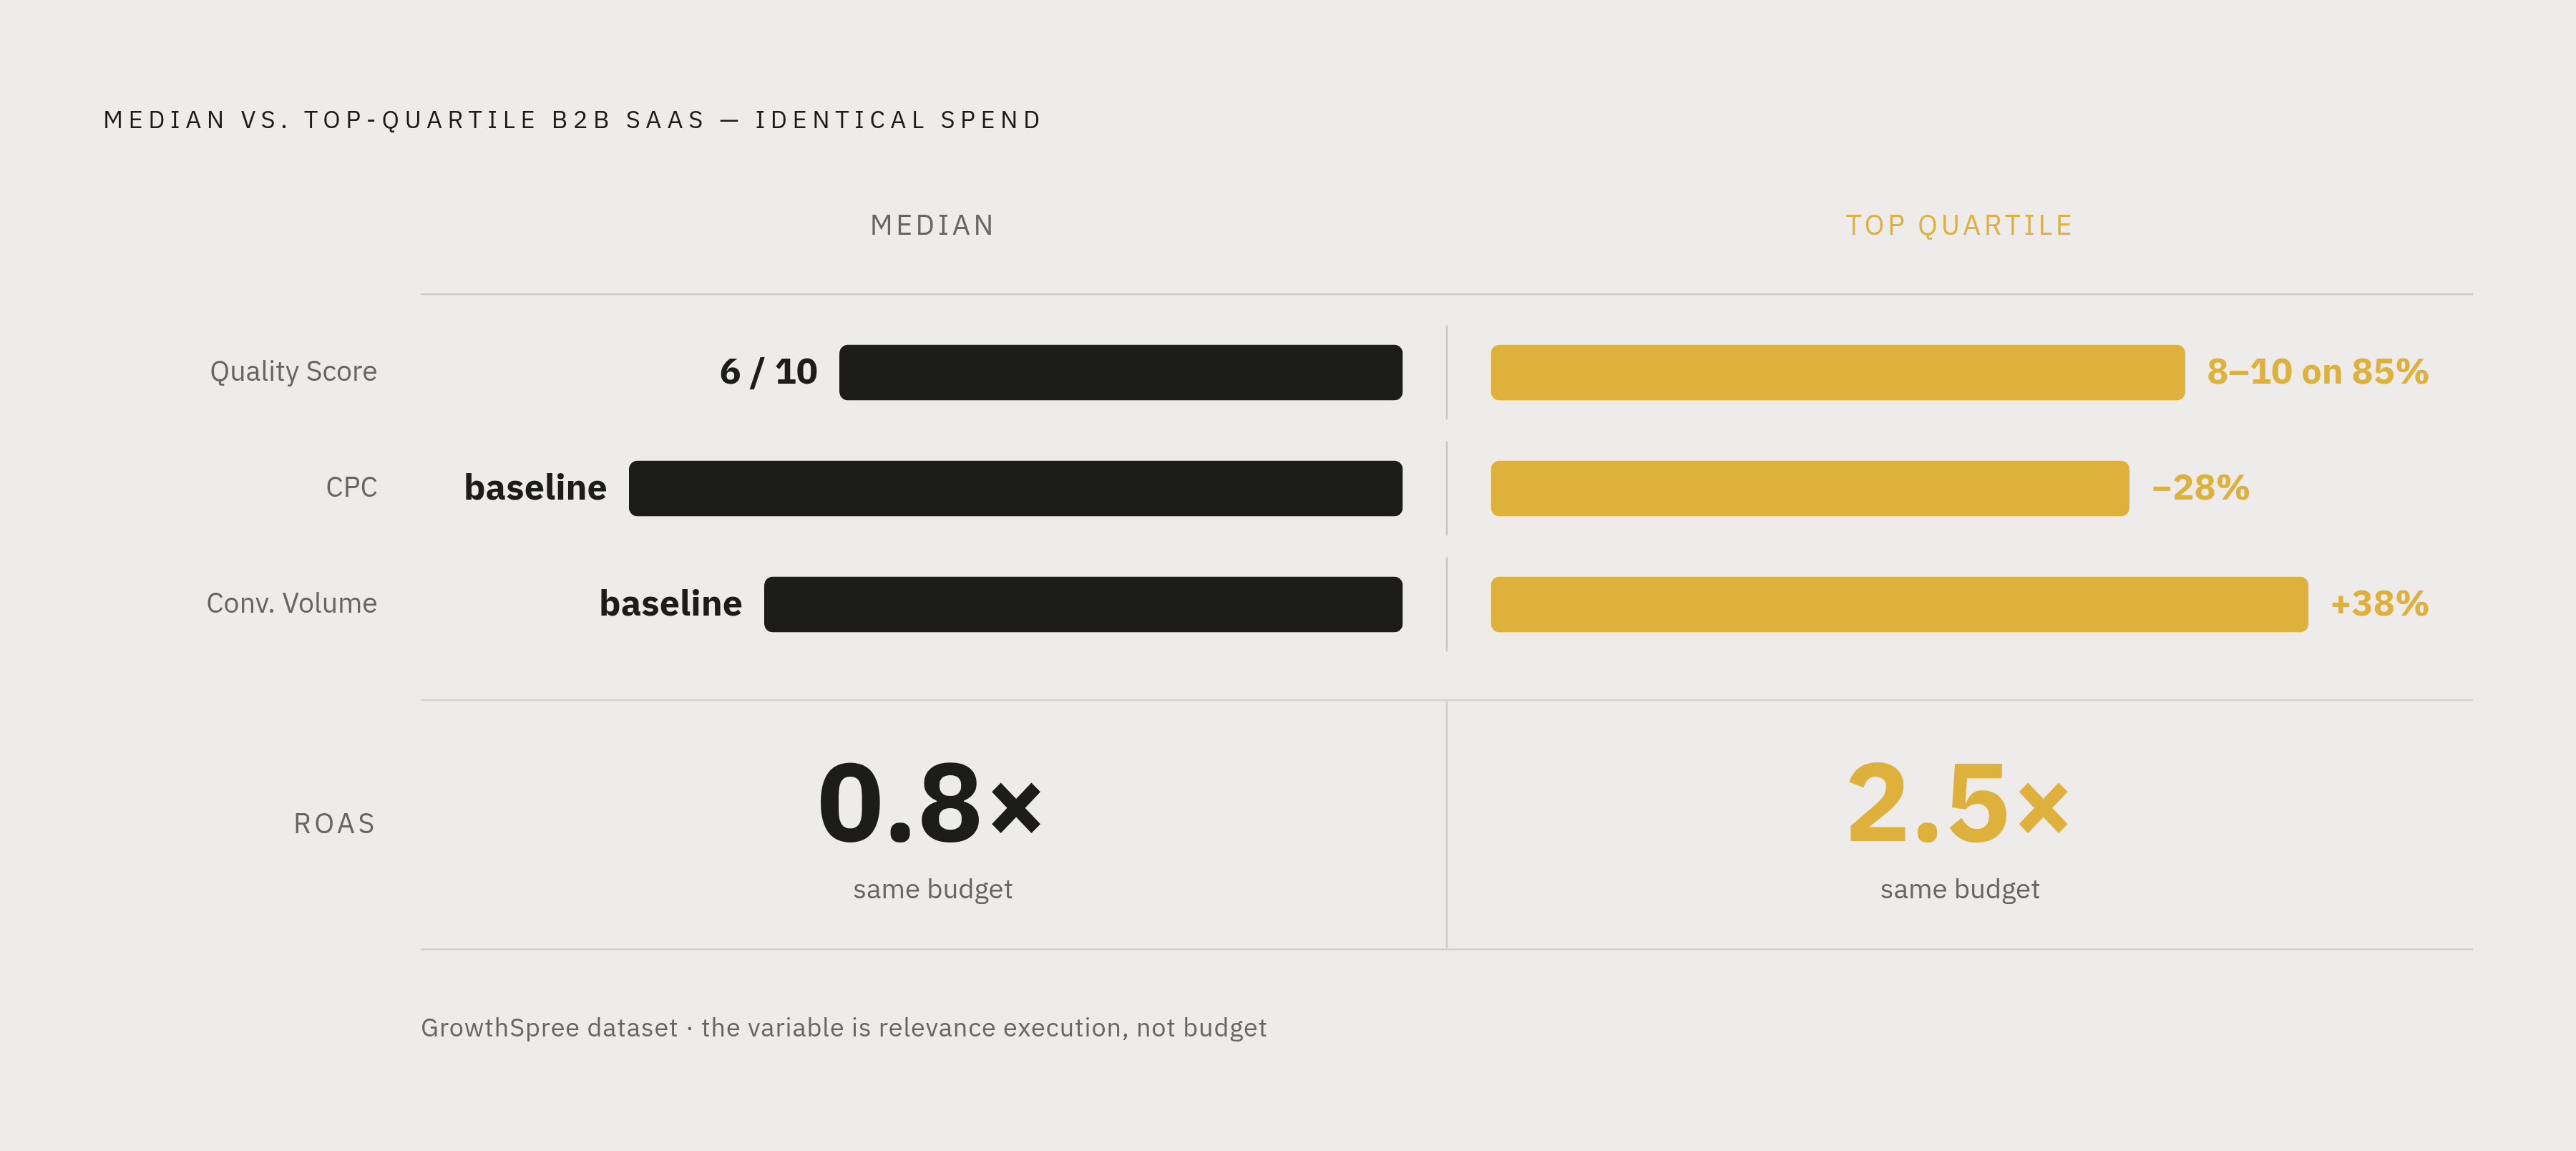
Among B2B SaaS accounts specifically, the median sits at 6, per audits of more than 300 accounts conducted by GrowthSpree between 2024 and 2026. One point above the industry median. Slightly better than average, still firmly in the "no meaningful discount" zone.
Top-quartile B2B SaaS accounts look meaningfully different. Those accounts hit Quality Scores of 8 to 10 across a large majority of their converting keywords.
The cost gap between median and top-quartile execution, per the same GrowthSpree dataset:
- 22 to 35% lower CPC
- 28 to 48% higher conversion volume at the same budget
- Roughly 0.8x ROAS versus 2.5x ROAS on identical spend
Same budget. Same platform. Wildly different returns. The variable isn't bidding strategy or spend level. It's relevance execution.
For early-stage companies, the gap can be sharper. Seed-stage B2B companies often face higher CPCs partly because less developed websites and weaker landing pages suppress Quality Scores from the start, per Firebrand's 2024 analysis. The penalty compounds before you've had a chance to build the credibility the algorithm rewards.
That raises a reasonable question: if the gap is this large and the cause is controllable, why aren't more accounts closing it? Landing pages live in a different system, owned by a different team, on a different sprint cycle. The fix requires coordination, and coordination is slow. So the gap persists.
Why Quality Score Optimization Matters More When the Market Is Getting Expensive
The broader market context makes all of this more urgent, not less.
Cross-industry average CPC on Search hit $2.96 in Q1 2026, up from $2.64 in Q1 2025. That's a 12% annual increase, the steepest climb since 2021, per data from WordStream and Search Engine Journal. B2B was among the verticals with the sharpest year-over-year increases.
Non-branded B2B search tells the more uncomfortable story. CPC jumped roughly 29% to an average of $5.34, while click-through rate dropped about 26% to an average of 4.04%, per Dreamdata's benchmark report covering August 2024 through July 2025. More spend. Worse engagement. A market getting simultaneously more expensive and less responsive.
The budget behavior that followed is understandable. Non-branded search's share of B2B ad budgets fell from about 38% in August 2024 to around 33% by July 2025. Advertisers pulled back from exactly the channel where Quality Score optimization would have protected them most.
Here's what's easy to miss when you're watching CPCs tick up month over month: a 22 to 35% CPC advantage from strong Quality Scores doesn't just maintain your efficiency in a rising market. It widens your competitive gap. Your competitors are absorbing full CPC inflation. You are not. Every quarter that passes, the difference gets larger.
Average cost per lead across all Google Ads industries moved from $66.69 in 2024 to $70.11 in 2025, a 5.13% increase per WordStream's 2025 data. B2B paid search sits well above that average. When the floor keeps rising, quality-driven CPC reduction stops being a nice-to-have and starts being a margin decision.
What Actually Moves Expected CTR in B2B Search Campaigns
Expected CTR is not a historical average of your clicks. It's a prediction. Google estimates it per keyword, per match type, per device, adjusted for position. So improving it isn't about boosting your overall click history. It's about demonstrating to Google that your ad is the right answer to that specific query.
The B2B-specific challenge is intent framing. When someone searches "reduce churn in enterprise SaaS" or "automate sales reporting," they have a problem they're trying to solve. A generic headline about your platform's capabilities doesn't match that frame. It answers a question they didn't ask.
A few things that actually move the needle:
Mirror the query language. Keyword insertion done carefully, or pinned headline variants that reflect the specific problem or outcome a query implies, tends to outperform generic product headlines. Not because of keyword matching mechanics, but because the ad feels like it's responding to the search, not broadcasting at it.
Name the problem or the outcome, not the category. "Cut sales cycle significantly" or "Stop losing deals to manual handoffs" performs differently than "Enterprise CRM Software." One is an answer. The other is a label.
Give Google real variety in RSA assets. Responsive Search Ads let Google test combinations, but only if your headlines and descriptions are meaningfully different from each other. Five variations of "The #1 Platform for Revenue Teams" is not variation. It's repetition with slightly different word order.
Keep ad groups tight. One theme, one buyer problem, one set of copy written for that specific intent. Broad ad groups force generic copy, and generic copy hurts CTR.
One mistake worth naming explicitly: pulling low-CTR ad variants before Google has enough impression data to draw a conclusion. The algorithm needs volume to learn. Pausing ads early slows down the learning cycle and leaves you with fewer data points, which is the opposite of what you need.
What Actually Moves Ad Relevance in B2B Accounts
Ad Relevance is not about keyword density. It's about whether your ad answers the intent behind the search. Those are meaningfully different things, and conflating them is where a lot of B2B copy goes wrong.
The common failure pattern is structural. Enterprise software ads describe platform capabilities. The buyer searched for an outcome. High keyword density. Low intent match. Below-average relevance score, in most cases.
Map ad groups to buyer problems, not product features. A software company might have features for "pipeline forecasting," "quota attainment tracking," and "rep activity logging." Those are three separate buyer problems, which means three separate ad groups and three separate sets of copy that speak to each problem directly. Not one ad group called "Sales Software" with headlines that describe all three features at once.
Write ads in the language of the problem. The product is the resolution, not the headline.
Run regular search term audits. Irrelevant queries triggering your ads drag down relevance signals. Negative keywords are as important as ad copy revisions, and they're often faster to implement. Most B2B accounts are dramatically under-negated. It's almost always the first thing I'd look at in an audit.
At roughly 22% estimated weight, Ad Relevance is not the biggest lever in the system. But it is often the fastest win. The problems are structural and fixable without touching the product, the landing page, or the budget. You reorganize how the account is built.
What Actually Moves Landing Page Experience — and Why It's Where the Real Money Is
Google evaluates landing page experience on four dimensions: relevance of page content to the ad and keyword, page load speed, mobile usability, and whether the page actually gives users what they came for without making them hunt for it.
The underinvestment problem here is structural and widespread. Ad teams optimize copy and bids on a weekly cycle. Landing pages get built once and stay that way for months, sometimes years. The highest-weight component in the Quality Score formula receives the least ongoing attention. Nobody decided that — it just happens by default, because landing pages live somewhere else in the organization, and getting them updated requires a meeting, a ticket, a sprint, and someone saying yes.
The B2B-specific failure modes are pretty consistent:
Sending all ad traffic to the homepage breaks the relevance signal immediately. The homepage is for everyone. Your ad promised something specific to someone specific.
Generic "Request a Demo" pages with no copy alignment to the keyword or ad that brought the visitor leave people re-orienting themselves on arrival, trying to figure out if they're even in the right place.
Long-form product pages full of feature lists the visitor didn't ask for, with a buried conversion action and no visible connection between the ad's promise and the page's content, are common in B2B and routinely suppress scores.
Mobile pages that are just desktop pages scaled down are not mobile pages. Google evaluates mobile experience independently, and a desktop layout squeezed into a mobile viewport doesn't pass that evaluation.
Where to start: clear the technical floor first. Page speed and mobile usability are table stakes. A slow page suppresses Landing Page Experience regardless of how well-written the content is — it's like putting a fresh coat of paint on a house with no foundation.
Then focus on message match. Dedicated landing pages per ad group theme, with headlines and copy that mirror the ad's promise and the keyword's intent, is the single most reliable way to lift Landing Page Experience scores. If your ad says "Cut sales cycle by 30%," the landing page headline should not say "Enterprise Revenue Intelligence Platform."
Because Landing Page Experience is so consistently underinvested relative to its weight, fixing it tends to produce the largest single-component Quality Score lift available in a B2B account. It is also the most annoying fix to actually execute, which is probably why it stays broken for so long.
How Quality Score Improvements Show Up in Pipeline Numbers
The chain from score to pipeline is fairly direct. Higher Quality Score produces lower CPC. Lower CPC produces more clicks at the same budget. More clicks produce more conversion opportunities. More conversion opportunities produce more MQLs and SQLs at lower cost per acquisition.
With average B2B Google Ads conversion rates on Search hovering around 3% per SalesHive's 2025 data, a 22 to 35% CPC reduction translates almost proportionally into a reduction in cost per MQL. And accounts that improve Quality Scores generate more conversion data, which feeds better Smart Bidding signals, which improves ad serving efficiency. Each iteration makes the next one a little more accurate.
There's also a budget reallocation opportunity that's easy to overlook. If CPC drops but budget stays flat, you get more clicks. You can take those clicks and scale the campaigns that are actually converting. Pipeline grows without growing the budget line.
But there's a failure mode that quietly erases all of this. Optimizing Quality Score while leaving attribution on Last Click means the algorithm finds the cheapest leads to hit its targets. Lead quality drops. Sales rejects them. Google never receives the feedback signal that would allow it to course-correct. Scores improve on paper while pipeline quality degrades behind the scenes.
The fix is closing the attribution loop. Feed Google conversion quality signals that reflect pipeline stage and deal value, not just form fills. When Smart Bidding can distinguish between a lead that closed and one that didn't, it starts optimizing toward actual buyers. That's the multiplier that separates sustainable Quality Score gains from temporary efficiency bumps that evaporate after a quarter.
Per GrowthSpree's 2024 to 2026 dataset, top-quartile execution shares a consistent profile: strong Quality Scores across converting keywords, dedicated landing pages aligned to ad group themes, and conversion values tied to pipeline stage. That combination is what separates the 0.8x ROAS accounts from the 2.5x ROAS accounts at identical spend.