MQL vs SQL in B2B Demand Generation
Lead source matters more than demographics in predicting which prospects will convert to sales.

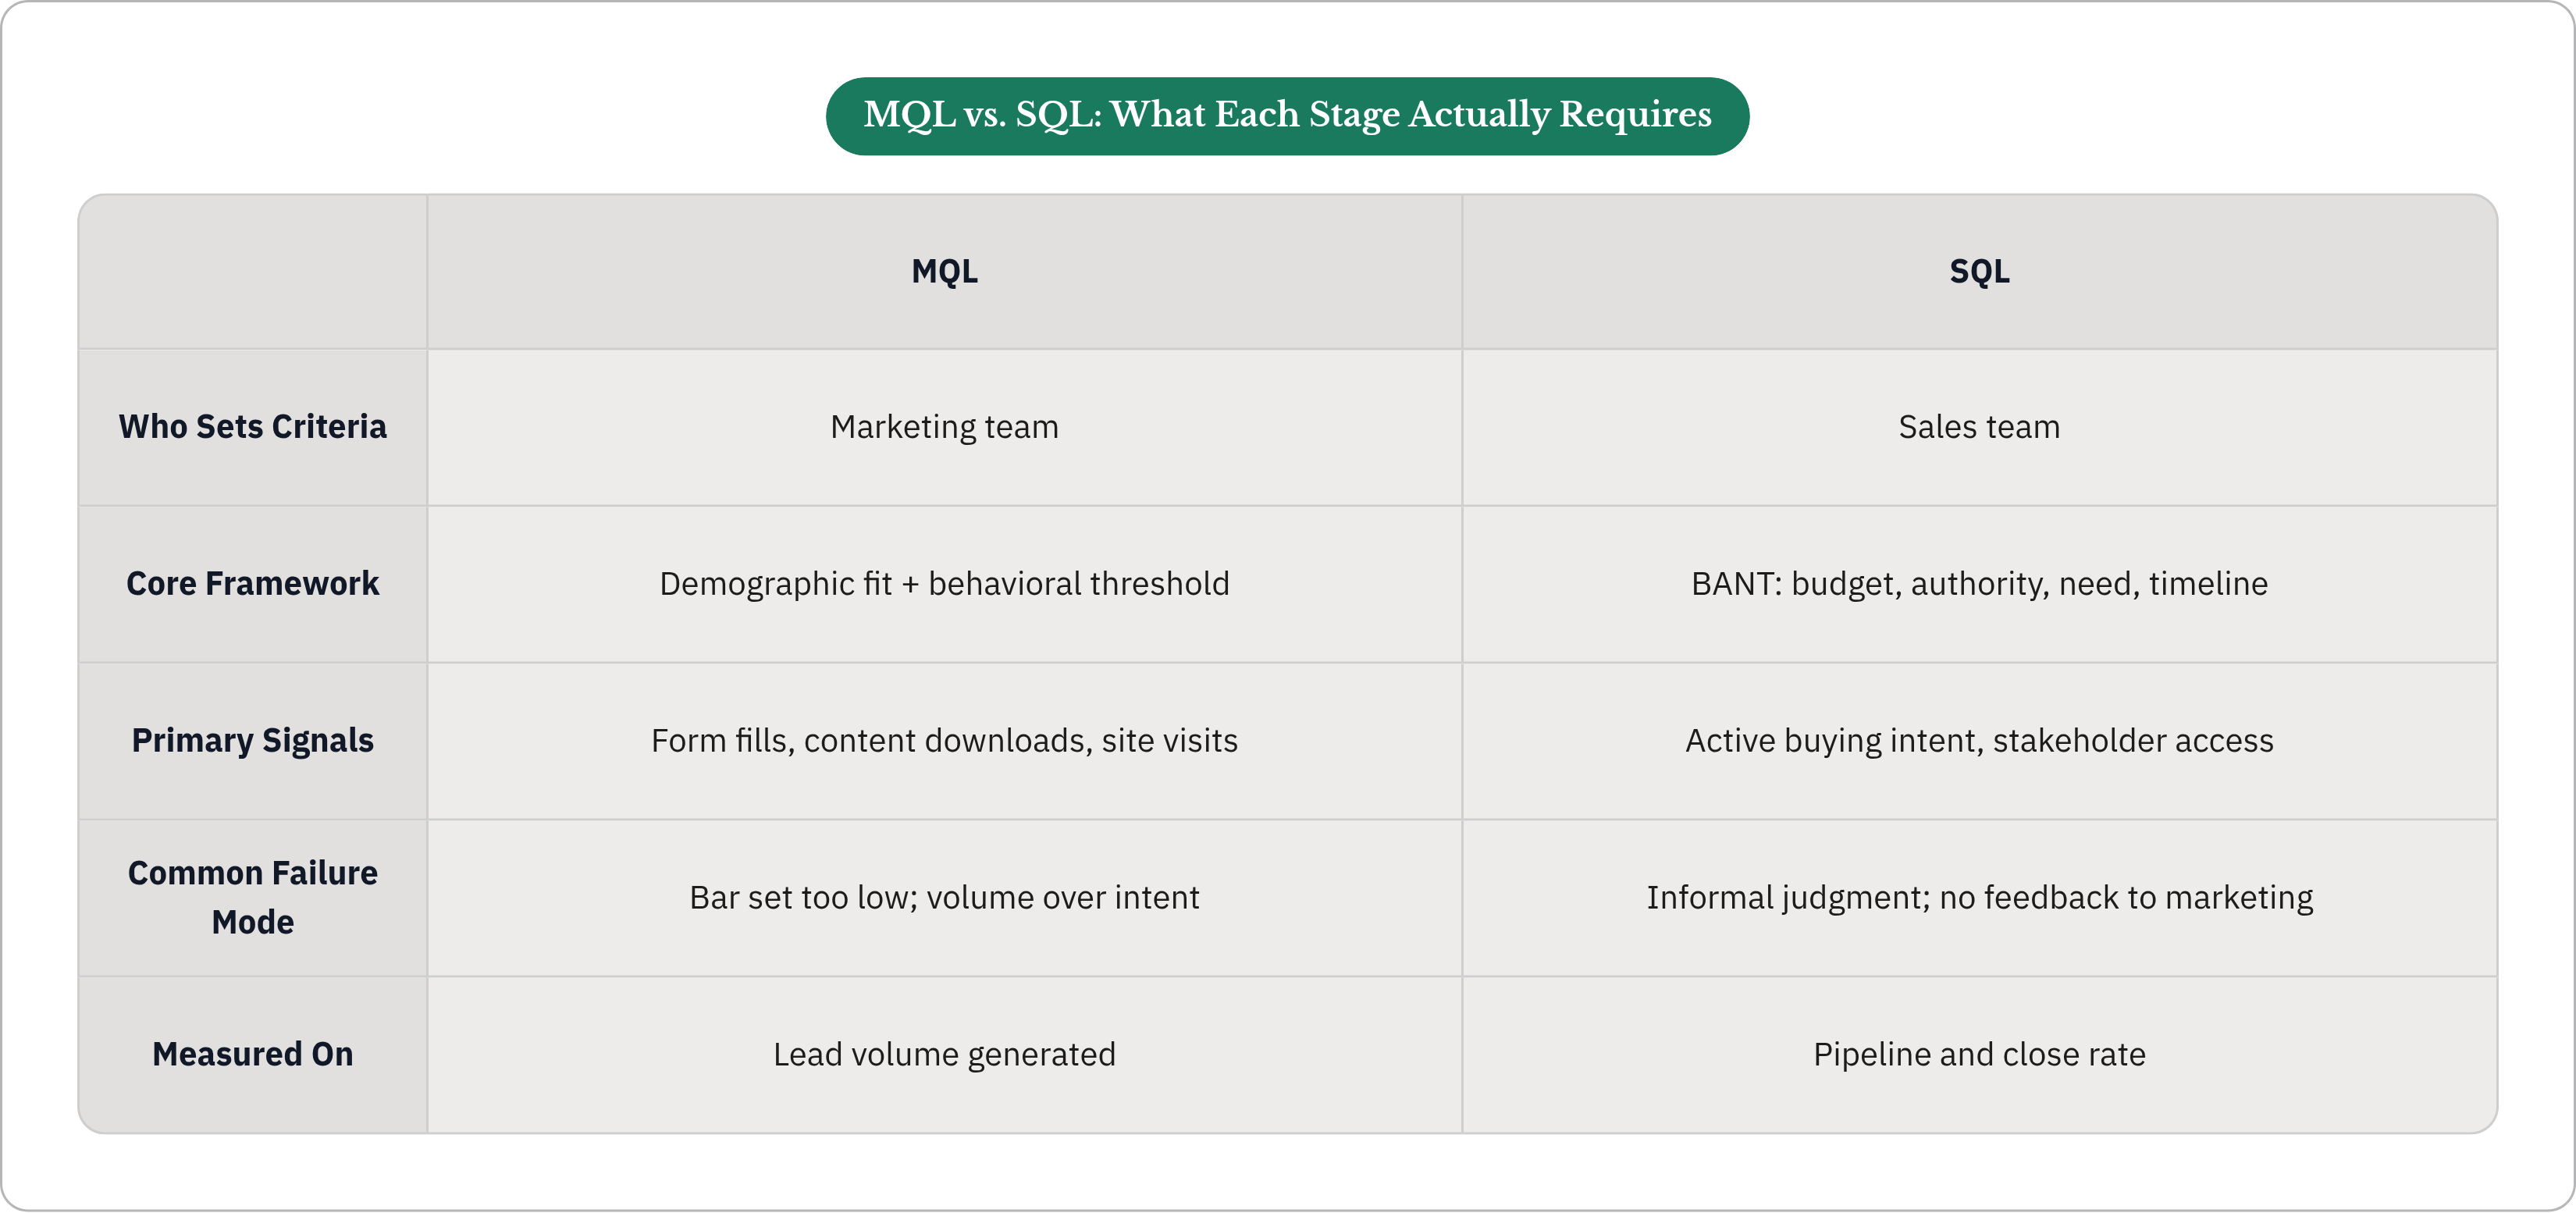
An MQL (marketing-qualified lead) is a lead that crossed a threshold marketing set. Usually some mix of who they are (job title, company size, industry) and what they have done (downloaded something, attended a webinar, visited the pricing page three times). Marketing looks at that combination and says: this one is ready to hand off.
An SQL (sales-qualified lead) is a lead sales has reviewed and accepted as worth actually pursuing. The classic framework is BANT: budget, authority, need, and timeline. Sales looks at the lead and says: yes, this person can buy, wants to buy, and has a reason to buy soon.
Both definitions sound clean. In practice, they almost never are.
Here is the real problem. The criteria for MQL are set by marketing. The criteria for SQL are applied by sales. And the two teams rarely sit down to agree on what connects them. Marketing draws a line in one place. Sales draws a line somewhere else. Leads fall into the gap, and nobody owns the gap — think of it like two people trying to pass a baton in a relay race, except neither agreed where the handoff zone was.
The failure modes on the marketing side cluster around a few patterns: thresholds set too low (any form fill counts, the bar is volume not intent), demographic scoring with no behavioral signal required, and criteria that have not been updated since the ICP shifted six months ago.
The failure modes on the sales side look different. Informal, inconsistent judgment. Rejections with no feedback to marketing. BANT applied mechanically to sales motions it was never designed for.
Per Demand Gen Report's 2024 Benchmark Survey, 74% of B2B marketers use lead scoring to determine MQLs. But 53% say their sales teams regularly reject those leads as not ready. That is not a lead quality problem. That is a definitional mismatch that has been running, unaddressed, at scale, for years.
Which raises an obvious question: if everyone knows the gap exists, why does it keep widening?
How bad the conversion math actually is, and what the benchmarks reveal
The B2B funnel drops off everywhere. Visitors who never fill a form. Leads who never respond to outreach. Opportunities that stall before close. But the MQL-to-SQL stage is the steepest single cliff in the sequence, and it does not get talked about proportionally to the damage it causes.
Industry average MQL-to-SQL conversion sits well below one in five. For every ten leads marketing is celebrating on its dashboard, fewer than two make it to a sales conversation.
That average is not flat across the market. Enterprise B2B teams with tight alignment and advanced qualification frameworks can hit roughly double the industry average. The performance gap between top and bottom performers at this specific stage is larger than at any other point in the funnel.
Which, if you stop and think about it, is strange. This is the stage with the most direct human involvement from both teams. And it is where the most value gets destroyed.
The downstream math is hard to ignore. A five-point improvement in MQL-to-SQL conversion can lift revenue meaningfully. For most teams, that is not a massive infrastructure overhaul. It is fixing a definition, tightening a scoring model, and adding a response SLA. Three things that cost almost nothing except the willingness to have an uncomfortable conversation between two teams that are both convinced the other one is the problem.
One thing the benchmarks leave unresolved: they lump together leads from wildly different sources, with wildly different intent levels. Pull them apart, and the picture changes considerably.
Why lead source explains most of the conversion rate variation teams can't account for
Here is a question worth sitting with. If two MQLs have the same job title, the same company size, and the same lead score, do they convert to SQL at the same rate?
No. Not even close.
Because the channel they came from tells you something the score does not: how much intent they brought with them when they raised their hand. A lead score is a snapshot. The source is the story behind it.
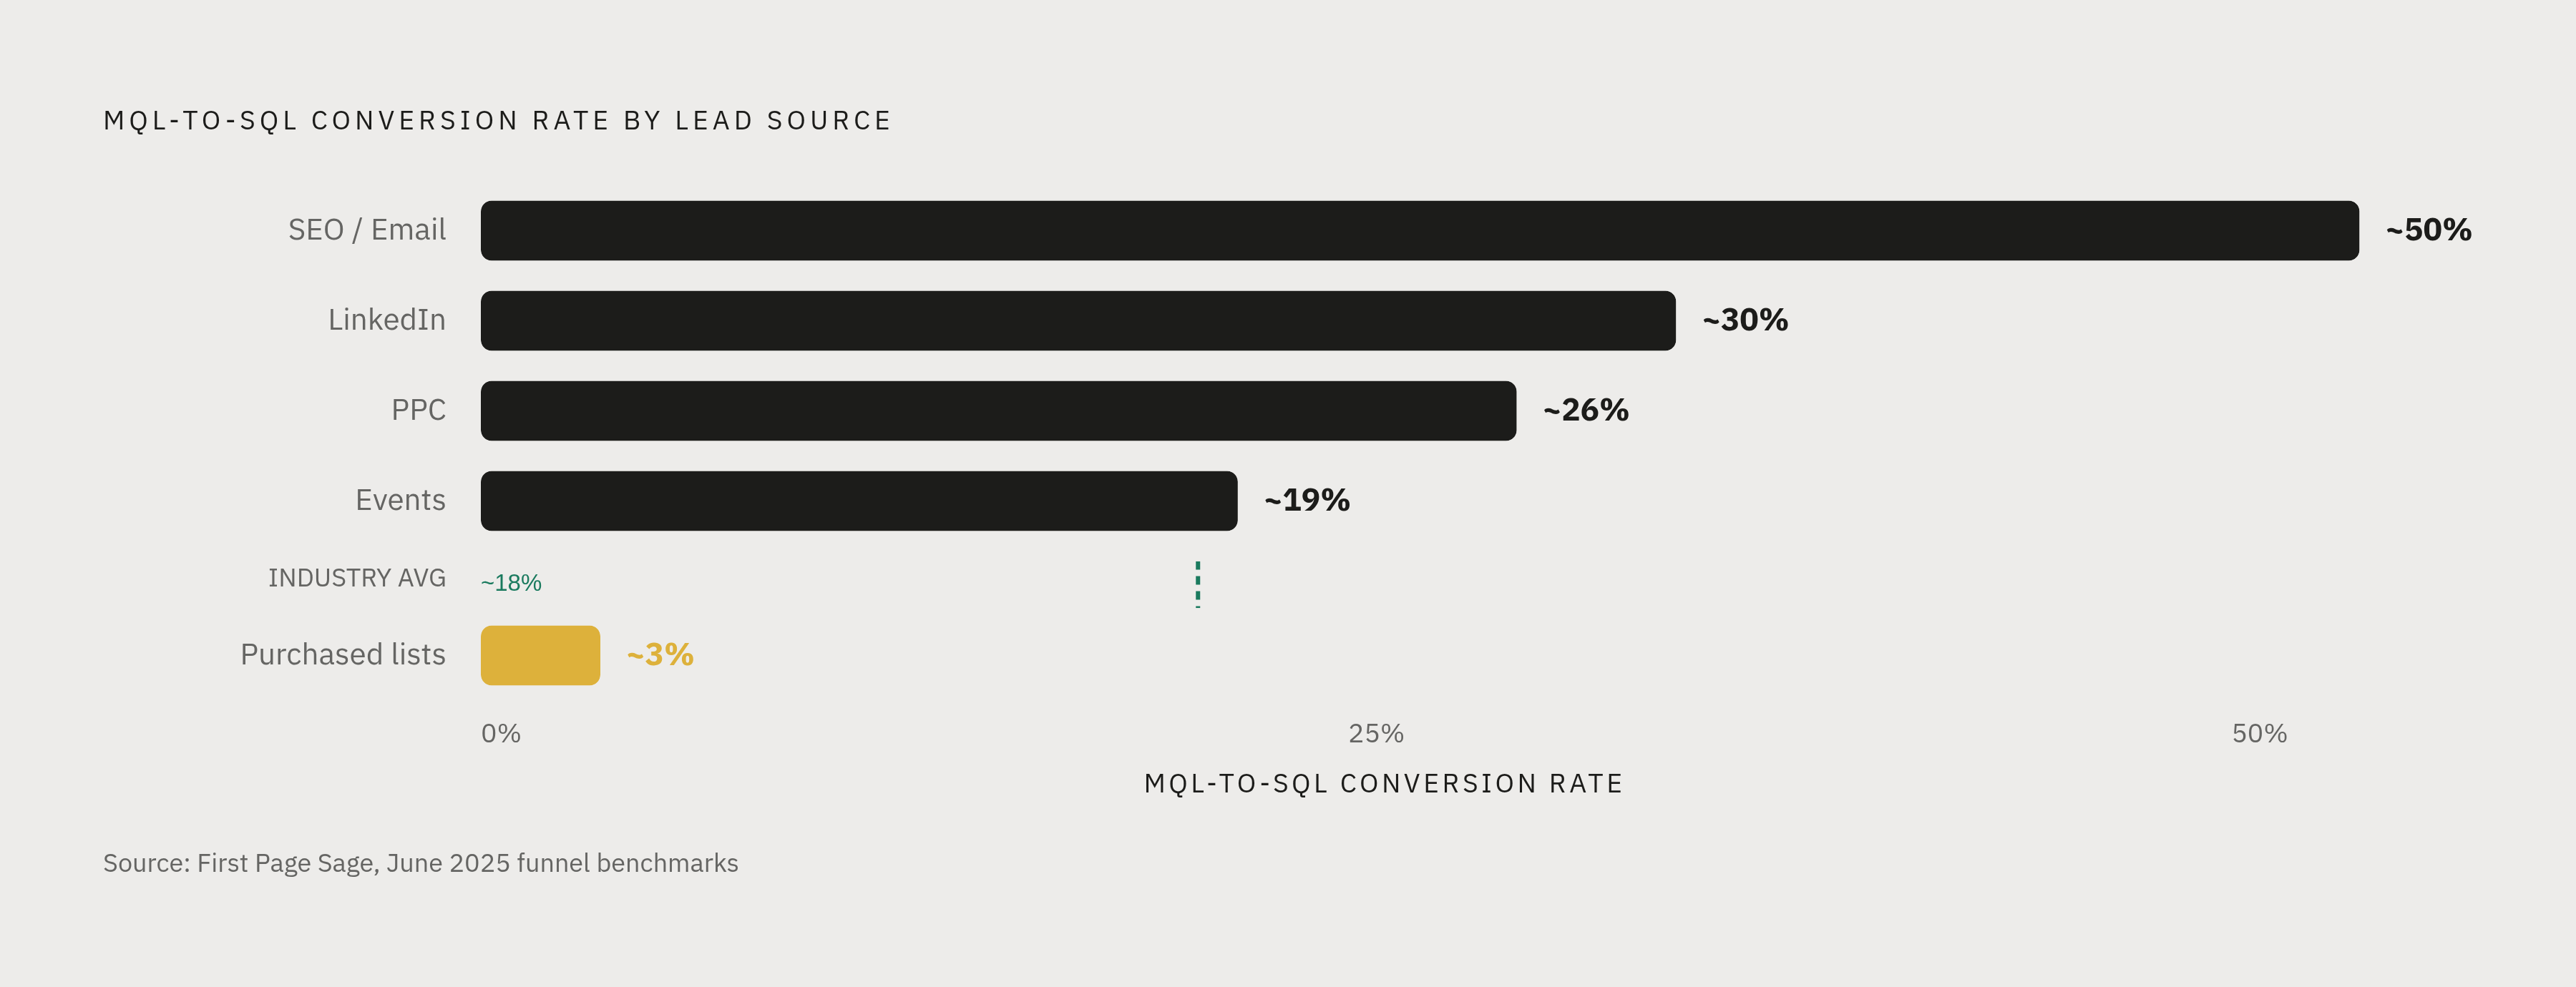
Per First Page Sage's funnel benchmarks from June 2025, conversion by source shows extreme variation:
- SEO and email-sourced leads convert at the highest rates. These are people who went looking, found something relevant, and opted in. Self-directed research intent is the strongest buying signal in the funnel.
- LinkedIn converts at an above-average rate. Above average, but below organic. The audience targeting is precise; the intent is more interrupted than self-directed.
- PPC converts at a below-average rate. High cost per lead, lower qualification rate than organic.
- Events underperform their reputation. Despite the relationship-building value, event leads convert at lower rates than most marketers expect.
- Purchased lists are at the bottom. Negligible SQL output.
Why does this matter operationally? Because when marketing is measured on MQL volume, budget naturally flows toward whatever channel produces the most form fills. And the channels that produce the most form fills are not the channels that produce the most SQLs. A campaign generating hundreds of MQLs from a purchased list or broad paid social push can look like a win on a marketing dashboard while quietly wrecking pipeline economics downstream. It is like fishing with a wide net in a pond full of the wrong fish — you will always come back with a full haul and an empty kitchen.
It is also worth considering what paid channels are actually for. Google captures in-market demand from buyers actively searching. LinkedIn builds awareness among the right personas before they are actively searching. Those are different jobs, and they deserve separate conversion benchmarks rather than being blended into one average that obscures both.
The practical shift is narrower than it sounds: measure each channel's SQL output, not its MQL output, and let that drive budget decisions. That single change reorients the entire demand generation program around pipeline rather than volume. Simple in theory. Politically complicated in practice, because it means some campaigns that look successful suddenly do not.
The scoring failure underneath most MQL-to-SQL problems
Most lead scoring models were built around demographic fit. Job title. Company size. Industry. Seniority. These signals tell you a lead could buy. They say almost nothing about whether that lead is buying right now.
Demographic scoring produces a population of leads that look right on paper but have shown no evidence of active buying intent. They match the ICP. They are just not in a buying cycle. Sending those to sales is not a handoff. It is an interruption dressed up as a handoff, and sales reps know the difference immediately, even if they cannot always articulate it.
Behavioral scoring asks a different question: what is this contact actually doing, and does that behavior suggest purchase consideration?
High-signal behaviors: visiting the pricing page, multiple site sessions within a short window, returning to the site after a sales interaction, consuming content that maps to late-stage research like comparison pages, implementation guides, or ROI calculators.
Lower-signal behaviors: downloading a whitepaper, registering for a webinar, clicking a newsletter link. That second list is not worthless. It is just high volume and weak intent. Treating it the same as the first list is where most scoring models quietly fall apart. Adding behavioral signals to scoring can boost conversion rates by up to 40%.
But what if the problem is not just which behaviors you track, but whose behaviors you track? Most teams still score individual contacts. There is a layer above that most teams still ignore: Marketing Qualified Accounts (MQAs). Instead of scoring one contact, you score the entire buying committee. You look at whether multiple stakeholders at the same account are showing engagement signals at the same time.
Per Forrester's 2024 State of Business Buying Report, buyers research an average of 17 different sources before contacting a vendor, and 83% of the B2B purchasing process now happens without direct contact with sales. A single contact's behavior is a thin signal. Account-level engagement patterns are a far better proxy for actual purchase intent. Teams still running purely demographic, contact-level scoring are optimizing a model designed for a buying process that no longer exists.
What happens after the pass: speed, handoff process, and the conversion window most teams miss
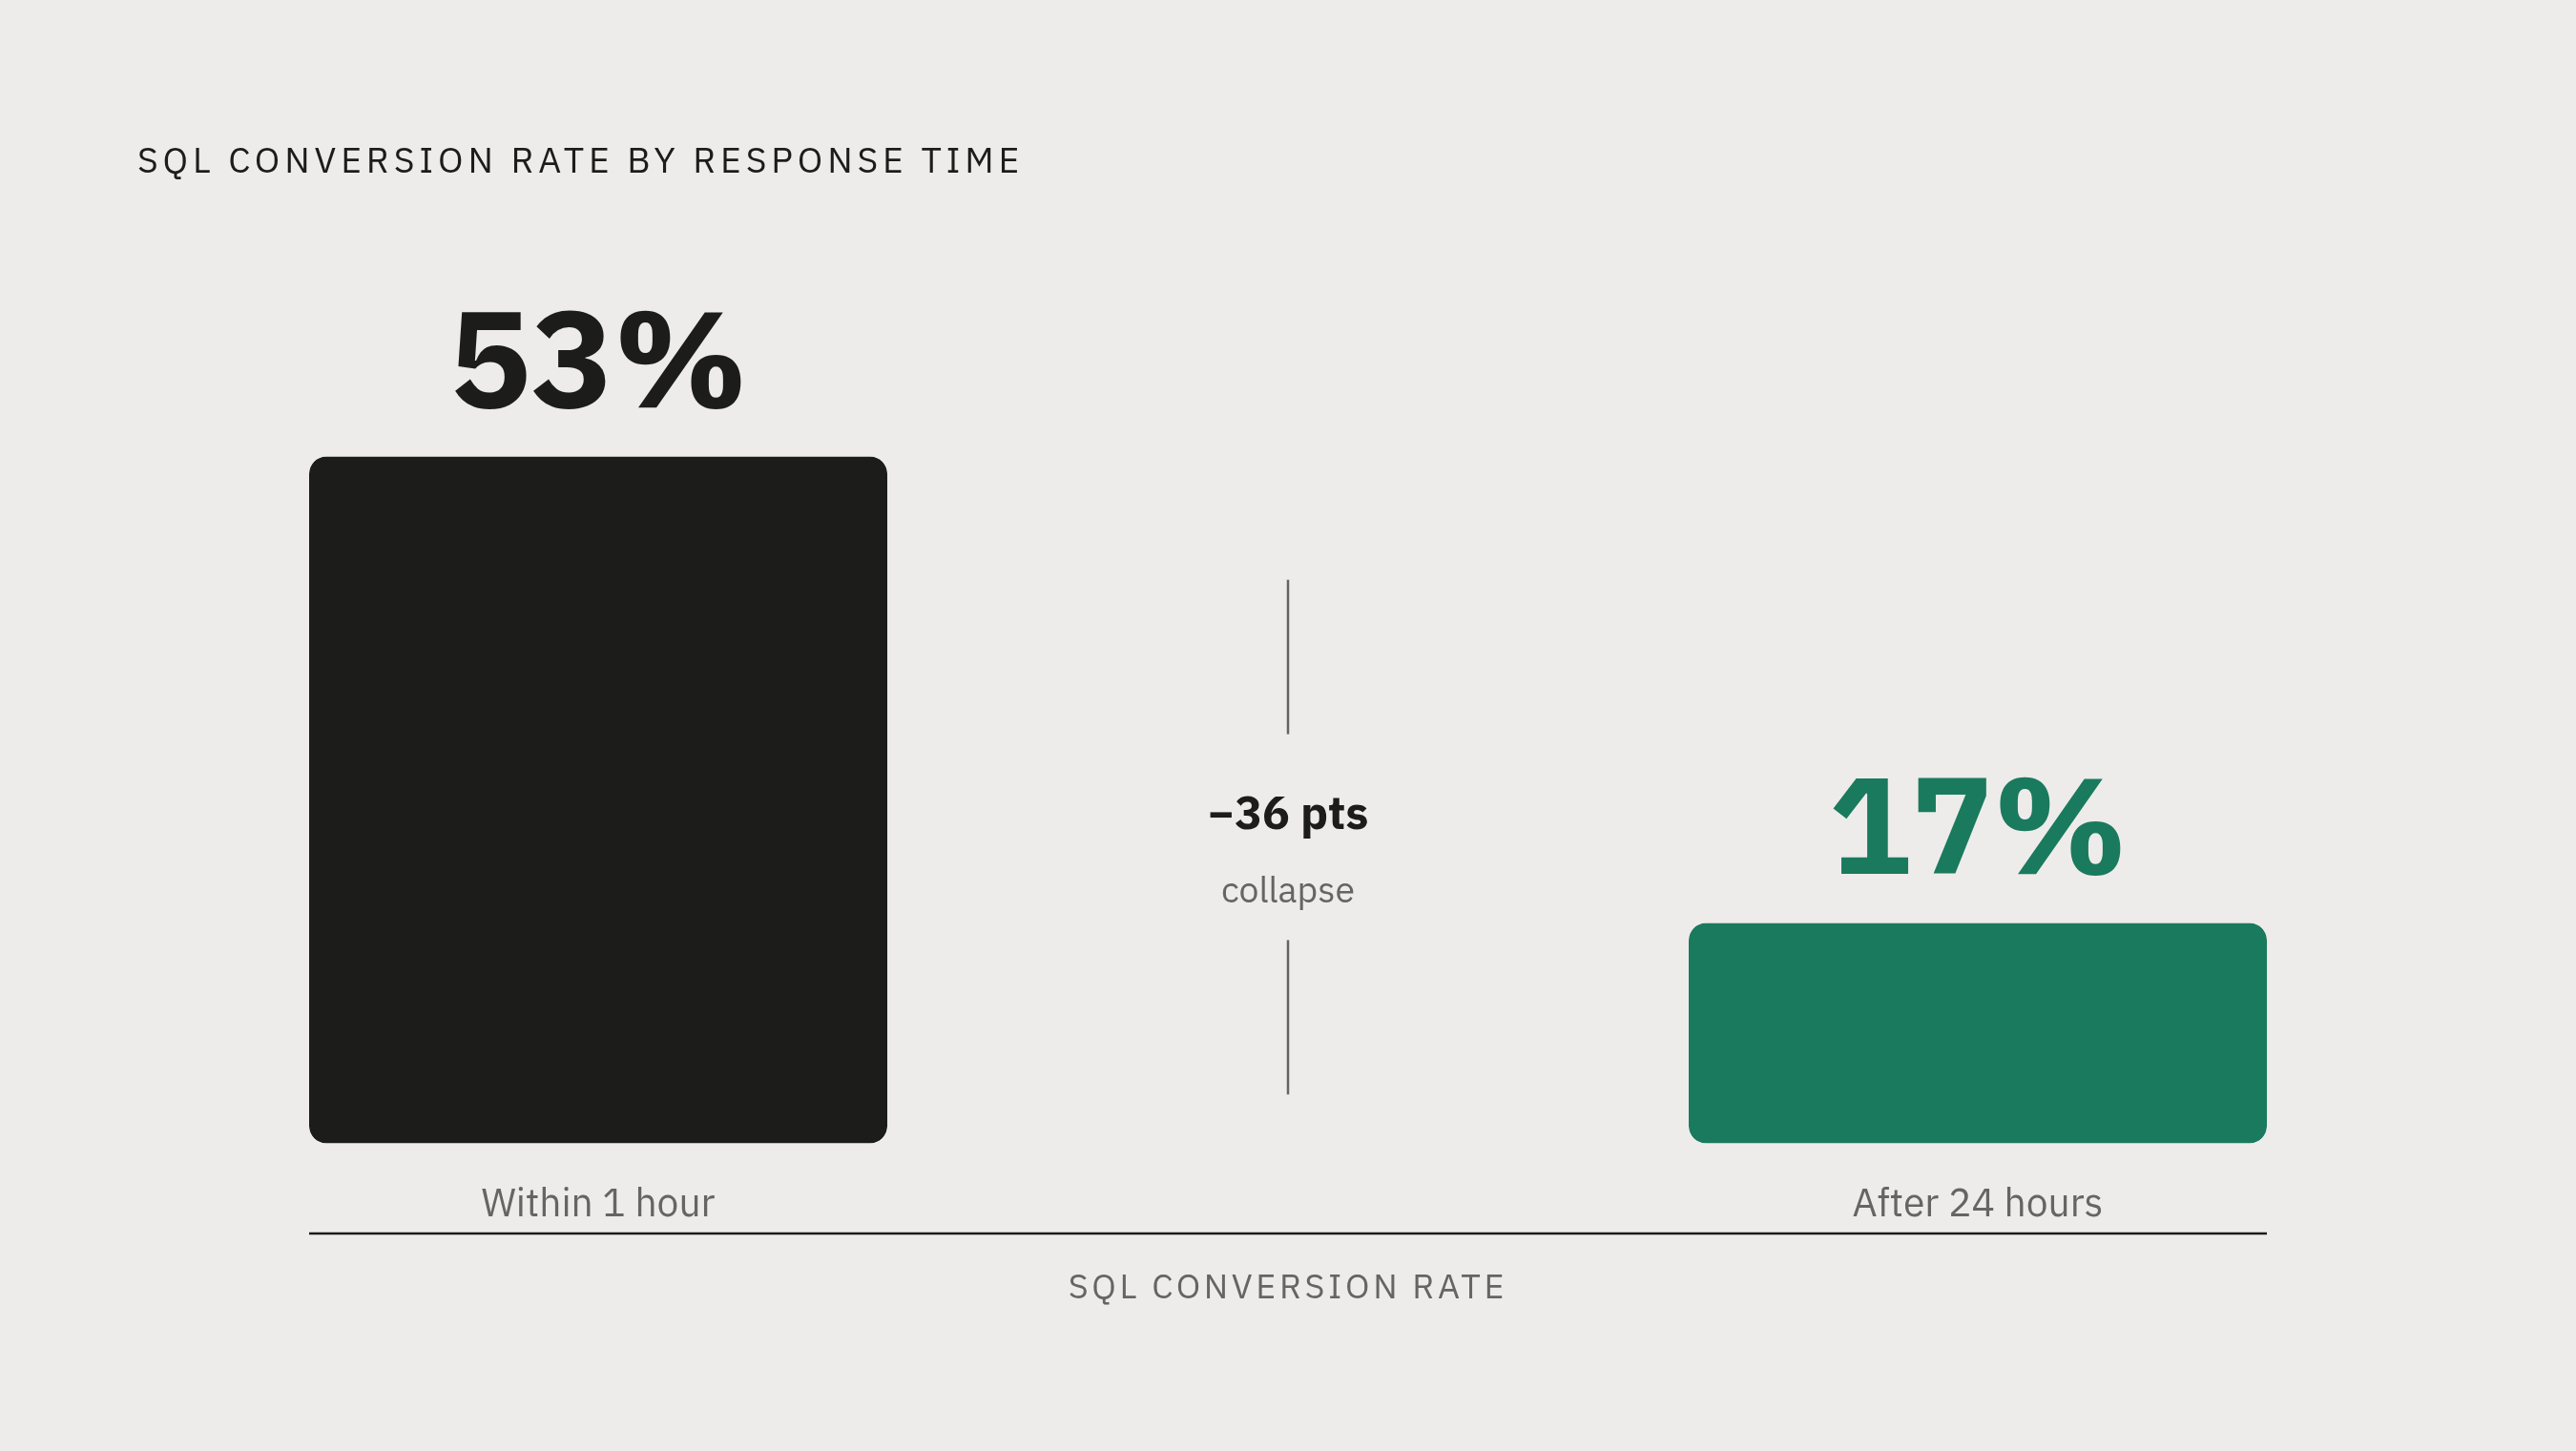
Accepting a lead as an SQL is a commitment to pursue it. The speed of that pursuit determines whether the qualification was worth anything.
Companies that follow up with SQLs within the first hour report a 53% conversion rate. Those that wait beyond 24 hours see that rate fall to 17%. That is not a creative problem. That is not a targeting problem. It is a process problem, and no amount of better upstream work compensates for it.
Where does speed die? Usually in the handoff itself:
- No defined SLA for how quickly sales must act on an accepted SQL.
- CRM routing delays where leads sit in a queue instead of triggering immediate action.
- Rep discretion on which SQLs to work first, with no accountability for response time.
The handoff is also where feedback loops break. Sales rejects a lead. Marketing never finds out why. The scoring model does not improve. The same kinds of unqualified leads keep arriving. Sales gets frustrated. Marketing gets defensive. Both are doing exactly what they are incentivized to do, which is the actual problem.
Sales reps are measured on pipeline and close rate, not on teaching marketing what a good lead looks like. Marketing is measured on MQL volume, not on what happens to those MQLs after the handoff. Neither team is doing anything wrong given what they are optimized for. They are just optimized for the wrong things relative to each other.
Aligned teams operate differently. They document SQL criteria together. They agree on a maximum response time for first contact after SQL acceptance. They build a rejection taxonomy so marketing receives structured data when leads are declined, and that data feeds back into scoring thresholds and channel allocation decisions.
Per Martal Group's 2025 analysis, aligned sales and marketing teams achieve 24% faster revenue growth and 36% higher customer retention. The performance gap between aligned and misaligned teams is not primarily a technology gap. It is a process and accountability gap. Most teams would rather buy a new tool than have the conversation that would actually fix it.
The metrics that actually measure pipeline health vs. the ones that measure activity
MQL volume measures marketing's output. It does not measure marketing's contribution to revenue. Those are different things, and the gap between them is where a lot of budget quietly disappears.
The metrics that actually track pipeline health:
- Cost per SQL. What it costs to produce a lead sales will actually pursue. This is the first metric that connects marketing spend to pipeline rather than to activity.
- MQL-to-SQL conversion rate by channel. Surfaces where lead quality is highest and where budget is producing form fills instead of pipeline.
- Marketing-sourced pipeline. Total pipeline value attributable to marketing-originated leads. Per a 2024 industry analyst survey across 412 B2B technology marketing leaders, the median sits at 64%.
- Cost per qualified opportunity. The fully loaded cost to produce a sales opportunity. The median across B2B tech is $1,847, with top-quartile teams achieving $940 or lower.
- SQL-to-closed-won rate. Closes the loop between pipeline generated and revenue realized.
What these metrics require that MQL reporting does not: attribution infrastructure that connects marketing activity to CRM outcomes, not just to form submissions. You cannot report on cost per SQL if your data stops at the form.
One might argue that MQL volume is still a useful leading indicator worth tracking alongside pipeline metrics. Maybe. But the moment volume becomes the primary metric, the incentive structure shifts toward producing volume. And channels that produce volume are rarely the channels that produce pipeline.
Weekly reporting on pipeline metrics, not monthly, is what separates teams that can correct mid-quarter from teams that discover the problem at end of quarter when nothing can be done about it.
Where AI changes the MQL-to-SQL conversion problem — and where it does not
AI's clearest contribution to the MQL-to-SQL problem is at the scoring and signal layer. Processing behavioral data at the volume and speed a modern B2B funnel produces is not something a human-maintained scoring model handles well. AI can.
Specifically: AI agents can reconstruct demand-state progression from fragmented signal data. Per Factors.ai's 2025 platform analysis and Demandbase's 2025 intent data commentary, AI-driven signal processing can surface 55% to 70% of in-market accounts that traditional first-party tracking misses. Accounts researching your category, showing buying committee engagement, moving through late-stage content. None of that captured by a form fill.
At the campaign execution layer, AI agents reduce the lag between detecting a buying signal and responding to it across channels, adjusting targeting, creative, and bid strategy before a human analyst has finished reviewing the data.
But here is where the AI conversation tends to go sideways. AI does not fix definitional disagreement between sales and marketing on what a qualified lead actually is. It does not fix missing SLAs or response-time accountability after the handoff. It does not fix weak attribution infrastructure.
AI compounds whatever data it receives. Fragmented CRM and ad platform data produces fragmented AI outputs. If the underlying process is broken, AI scales the broken process faster. That is a real thing that happens, and it is expensive.
For teams running paid media on Google and LinkedIn specifically, full-stack AI execution closes a real gap: the lag between campaign performance data and the next optimization decision. Thunder Agent OS operates at this layer. It runs Google and LinkedIn campaigns end to end using purpose-built AI agents, with weekly reporting on pipeline outcomes like cost per SQL and marketing-sourced pipeline rather than impressions or MQL volume. Each campaign cycle produces data that refines the next, so scoring thresholds, channel allocation, and creative performance improve continuously rather than waiting for a manual audit cycle.
Per McKinsey's 2026 B2B Pulse Survey, 59% of growth leaders cite seller efficiency as the primary benefit of embedding AI into core workflows. The gain is not replacing human judgment. It is removing the manual work that delays applying human judgment where it actually matters.
A practical framework for closing the gap: where revenue leaders should start
The sequence here matters more than most teams realize. Skipping to technology without fixing definitional and process problems first does not accelerate improvement. It accelerates the wrong outcomes.
Start with definitions. Hold a joint sales-marketing session and document MQL and SQL criteria together. Treat mismatches as discovery, not conflict. Ask specifically what behaviors qualify as high-intent signals, what firmographic criteria are non-negotiable, and what triggers an automatic disqualification. This conversation is uncomfortable. Do it anyway.
Audit lead source conversion. Pull MQL-to-SQL rate by channel for the last two quarters. Identify where budget is producing SQLs and where it is producing form fills. Reallocate toward channels with demonstrated SQL output. Expect resistance from whoever owns the channels that look worse.
Rebuild scoring around behavioral signals. Identify the three to five on-site or engagement behaviors that correlate most strongly with SQL acceptance in your historical data. Weight those heavily. Reduce weight on demographic-only signals. For deals with multi-stakeholder buying committees, layer in account-level scoring.
Establish handoff SLAs and feedback loops. Define a maximum response time for sales to act on an accepted SQL. Build a rejection taxonomy so marketing receives structured data on why leads were declined, and feed that data back into scoring. No rejection without a reason.
Replace MQL volume with pipeline metrics in reporting. Cost per SQL, MQL-to-SQL conversion by channel, marketing-sourced pipeline, and cost per qualified opportunity become the primary demand generation KPIs. Run them weekly. If the metrics are monthly, problems surface after the quarter is already gone.
None of this is a one-quarter project. ICPs shift. Buying behavior evolves. Channel performance changes. The teams that close the gap and stay ahead of it treat pipeline conversion as an ongoing operational discipline, not something to revisit when the numbers look bad. The ones who treat it as a one-time fix tend to be asking the same questions again twelve months later, usually with more urgency and less runway.