Google Ads Budget Allocation Across B2B Revenue Stages
Stage-specific Google Ads budgets beat one-size-fits-all percentages.

There is a piece of conventional wisdom in B2B marketing that goes something like this: take a percentage of revenue, carve out a portion for paid search, adjust annually, repeat. Gartner's 2025 CMO Spend Survey puts average marketing budgets at around 7.7% of company revenue. Other 2025 benchmarks land near 9.4%. That gap — nearly two full percentage points — is already wide enough to make any single figure nearly useless as a planning anchor.
But here is the deeper problem. Even if you landed on a perfect percentage, it still would not tell you what your Google Ads budget is actually supposed to do.
A pre-product-market-fit startup and a mature enterprise with identical revenue figures need fundamentally different things from paid search. The percentage approach misses the variables that actually determine whether money produces pipeline: campaign type, intent signal, and conversion objective. So the better question is not "how much should we spend?" It is "what is our Google Ads budget supposed to accomplish at this stage of the business?" That question changes everything.
Google Is a Capture Channel, Not a Creation Channel. That Distinction Matters Before You Size Anything.
Google Ads reaches buyers who are already searching. It does not reach buyers who do not yet know they have a problem. This sounds obvious, but the implications get ignored constantly when people size budgets.
What this means in practice: the Google budget is not sized in a vacuum. It is sized relative to how much demand exists to capture. And that varies dramatically by stage.
The structural relationship between Google and LinkedIn is worth understanding here. LinkedIn creates familiarity. It surfaces your brand to buyers who are not yet searching. Google captures the intent that LinkedIn primed weeks or months earlier. Running Google alone captures only the demand that already exists, and nothing upstream of it. Running LinkedIn alone builds awareness with no reliable mechanism to capture the moment a buyer acts on it. Think of it this way: LinkedIn plants the seed, and Google harvests the crop — but you cannot harvest what was never grown.
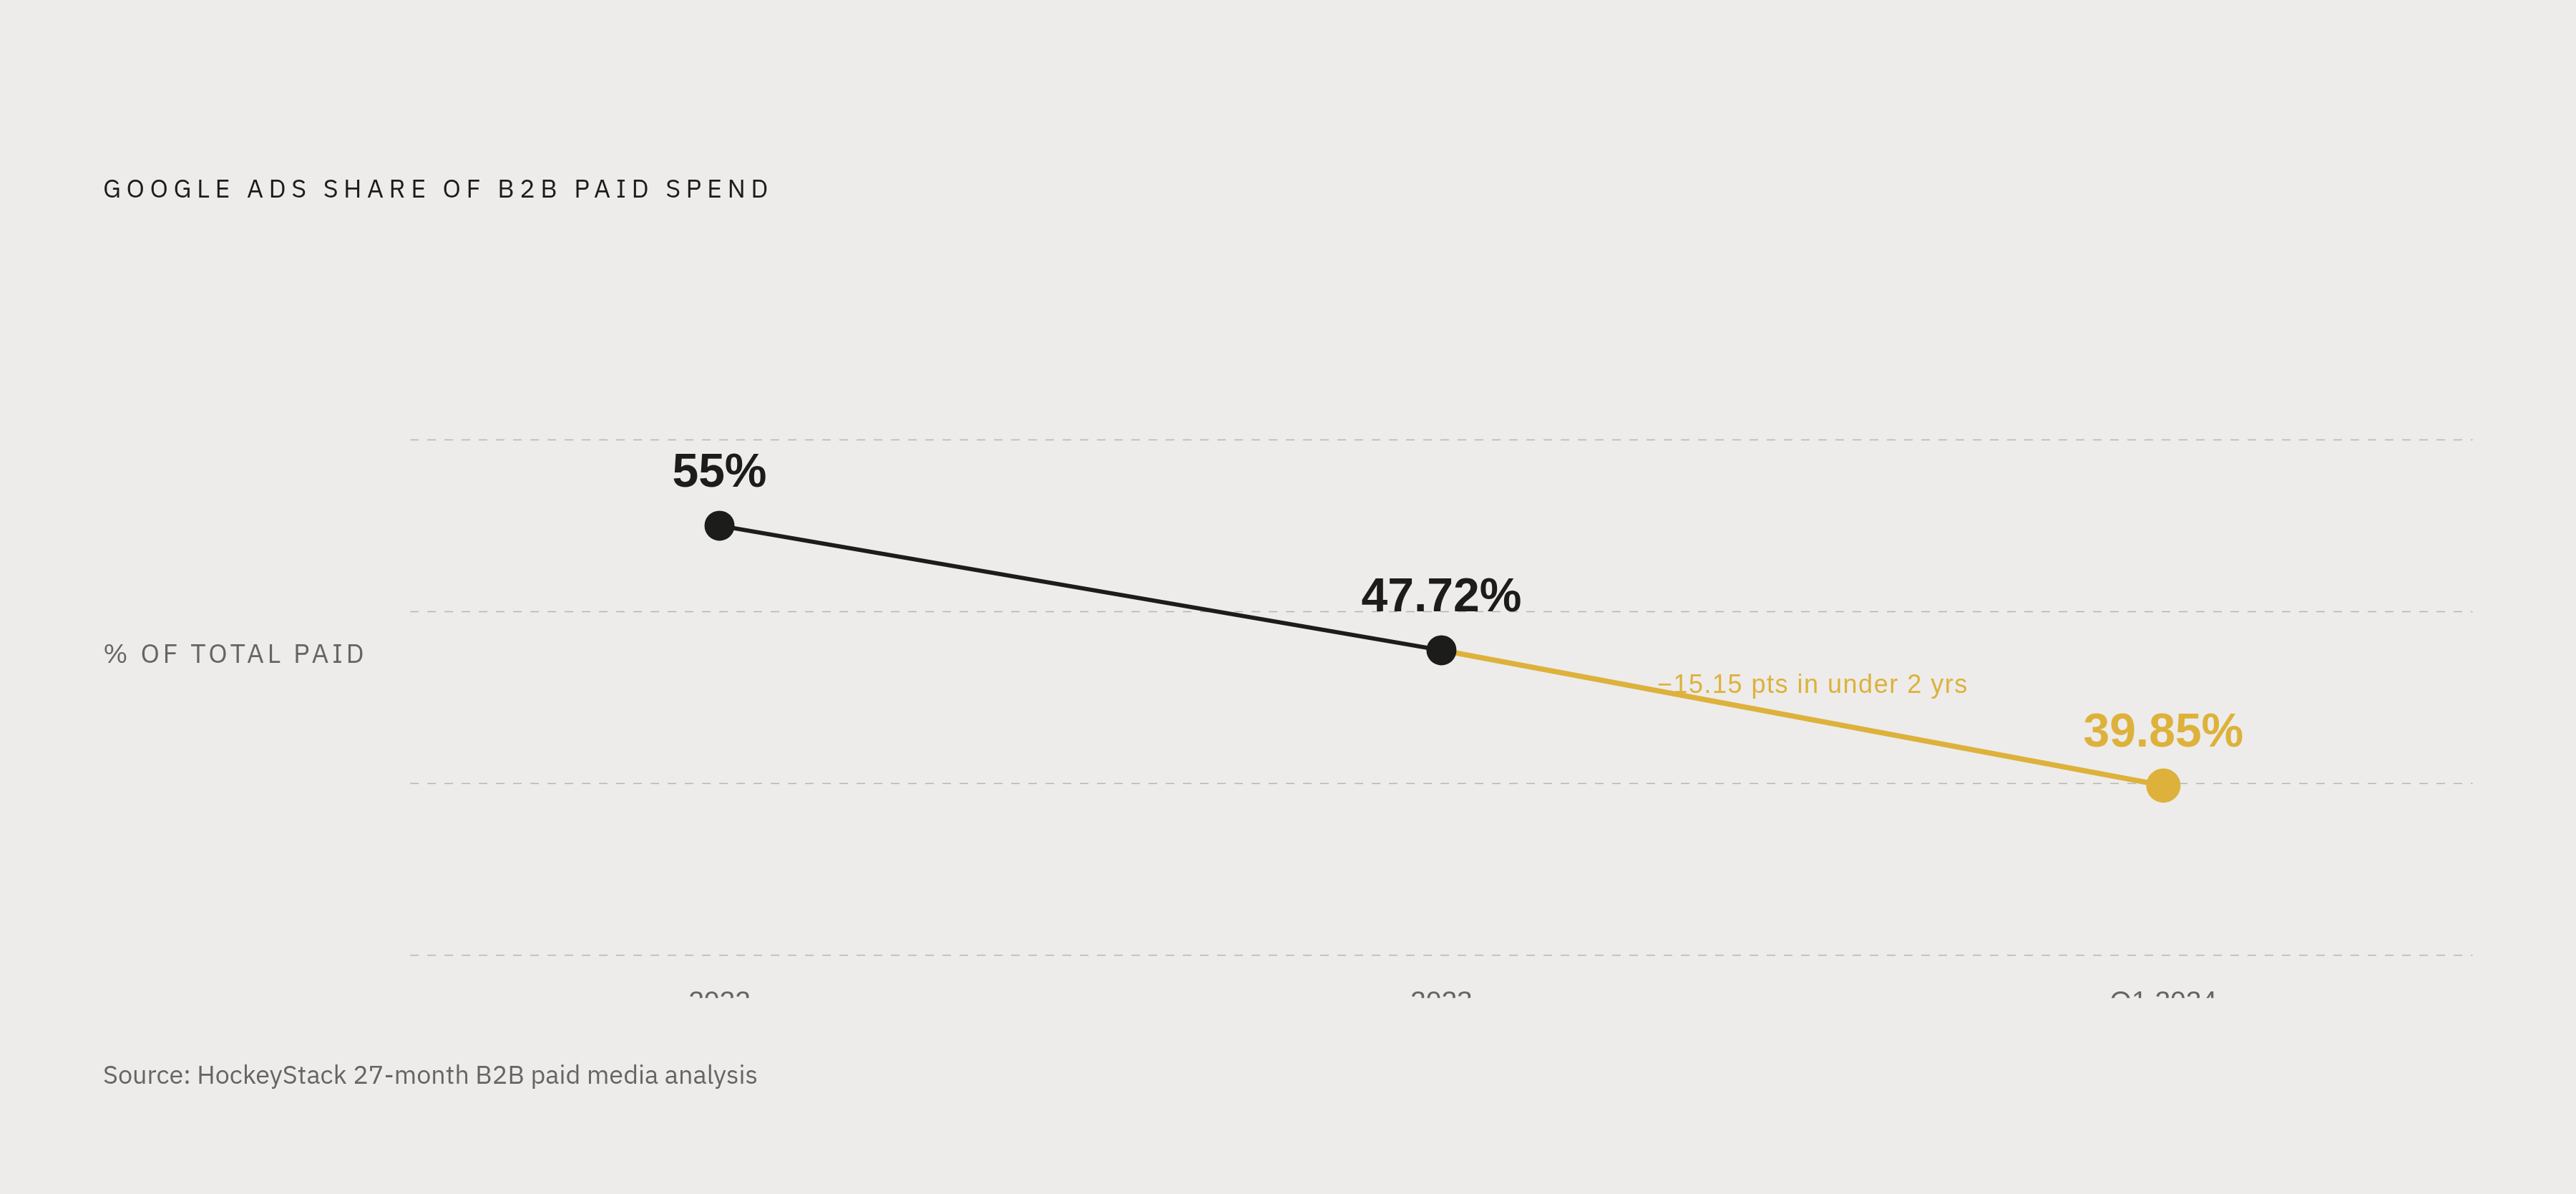
HockeyStack ran a 27-month analysis (January 2022 through Q1 2024) across B2B paid budgets and found Google averaged 49.22% of total spend over that period. But the trend line was moving. Google held roughly 55% in 2022, dropped to around 47.72% in 2023, and fell further to around 39.85% in Q1 2024. Budget was migrating toward channels that build upstream demand. That reflects a growing recognition that capture channels need creation channels to feed them.
There is also a newer pressure on the capture role itself. AI Overviews now appear in roughly 48% of searches and have driven a 68% drop in paid click-through rates on queries where they appear, according to Seer Interactive's 2026 analysis of over 3,000 informational queries. B2B tech queries specifically saw a 128% year-over-year jump in AI Overview presence. Informational queries — the ones at the top of the funnel — are increasingly being answered before a user ever reaches a paid result. It is a bit like setting up a lemonade stand only to find a vending machine already on every corner.
The response is not to spend more defending informational real estate. It is to get sharper about which queries actually signal purchase readiness. Intent-signal precision becomes more valuable, not less. Keep that in mind as we move into the stage breakdown.
The Three Revenue Stages, and What Each One Is Actually Asking Google to Do
This is worth saying plainly before we go further: the stages are not purely correlated with company size or ARR.
A well-funded startup can be in a growth stage. A mid-market company can revert to early-stage dynamics after entering a new market or a new ICP segment. What defines the stage is not headcount or funding round. It is search demand volume for the category, the number of validated converting keywords, SQL-to-opportunity conversion rate, and whether the algorithm has enough data to learn from.
That last one is not soft. Google's Smart Bidding needs roughly 30 conversions in 7 days per campaign to exit the learning phase. Below that threshold, automated bidding cannot function as designed. You are paying for a machine that cannot run yet.
With that grounding, here are the three stages:
Stage 1. Early (pre-PMF to early traction). Primary job: signal gathering. Not scale. You need to learn which queries convert, which audiences respond, and what CPL the business can sustain.
Stage 2. Growth (scaling what works). Primary job: efficient volume. The winning keywords and conversion paths are known. The goal shifts to expanding reach without degrading unit economics.
Stage 3. Mature (defending position). Primary job: market share protection. Branded search, competitive conquest, and retention-adjacent campaigns take on more weight. The threat is losing existing demand as much as failing to create new demand.
Each stage implies a different distribution across campaign types. Not just a different total number.
Early Stage: Your Budget Has One Job, and It Is Not Leads
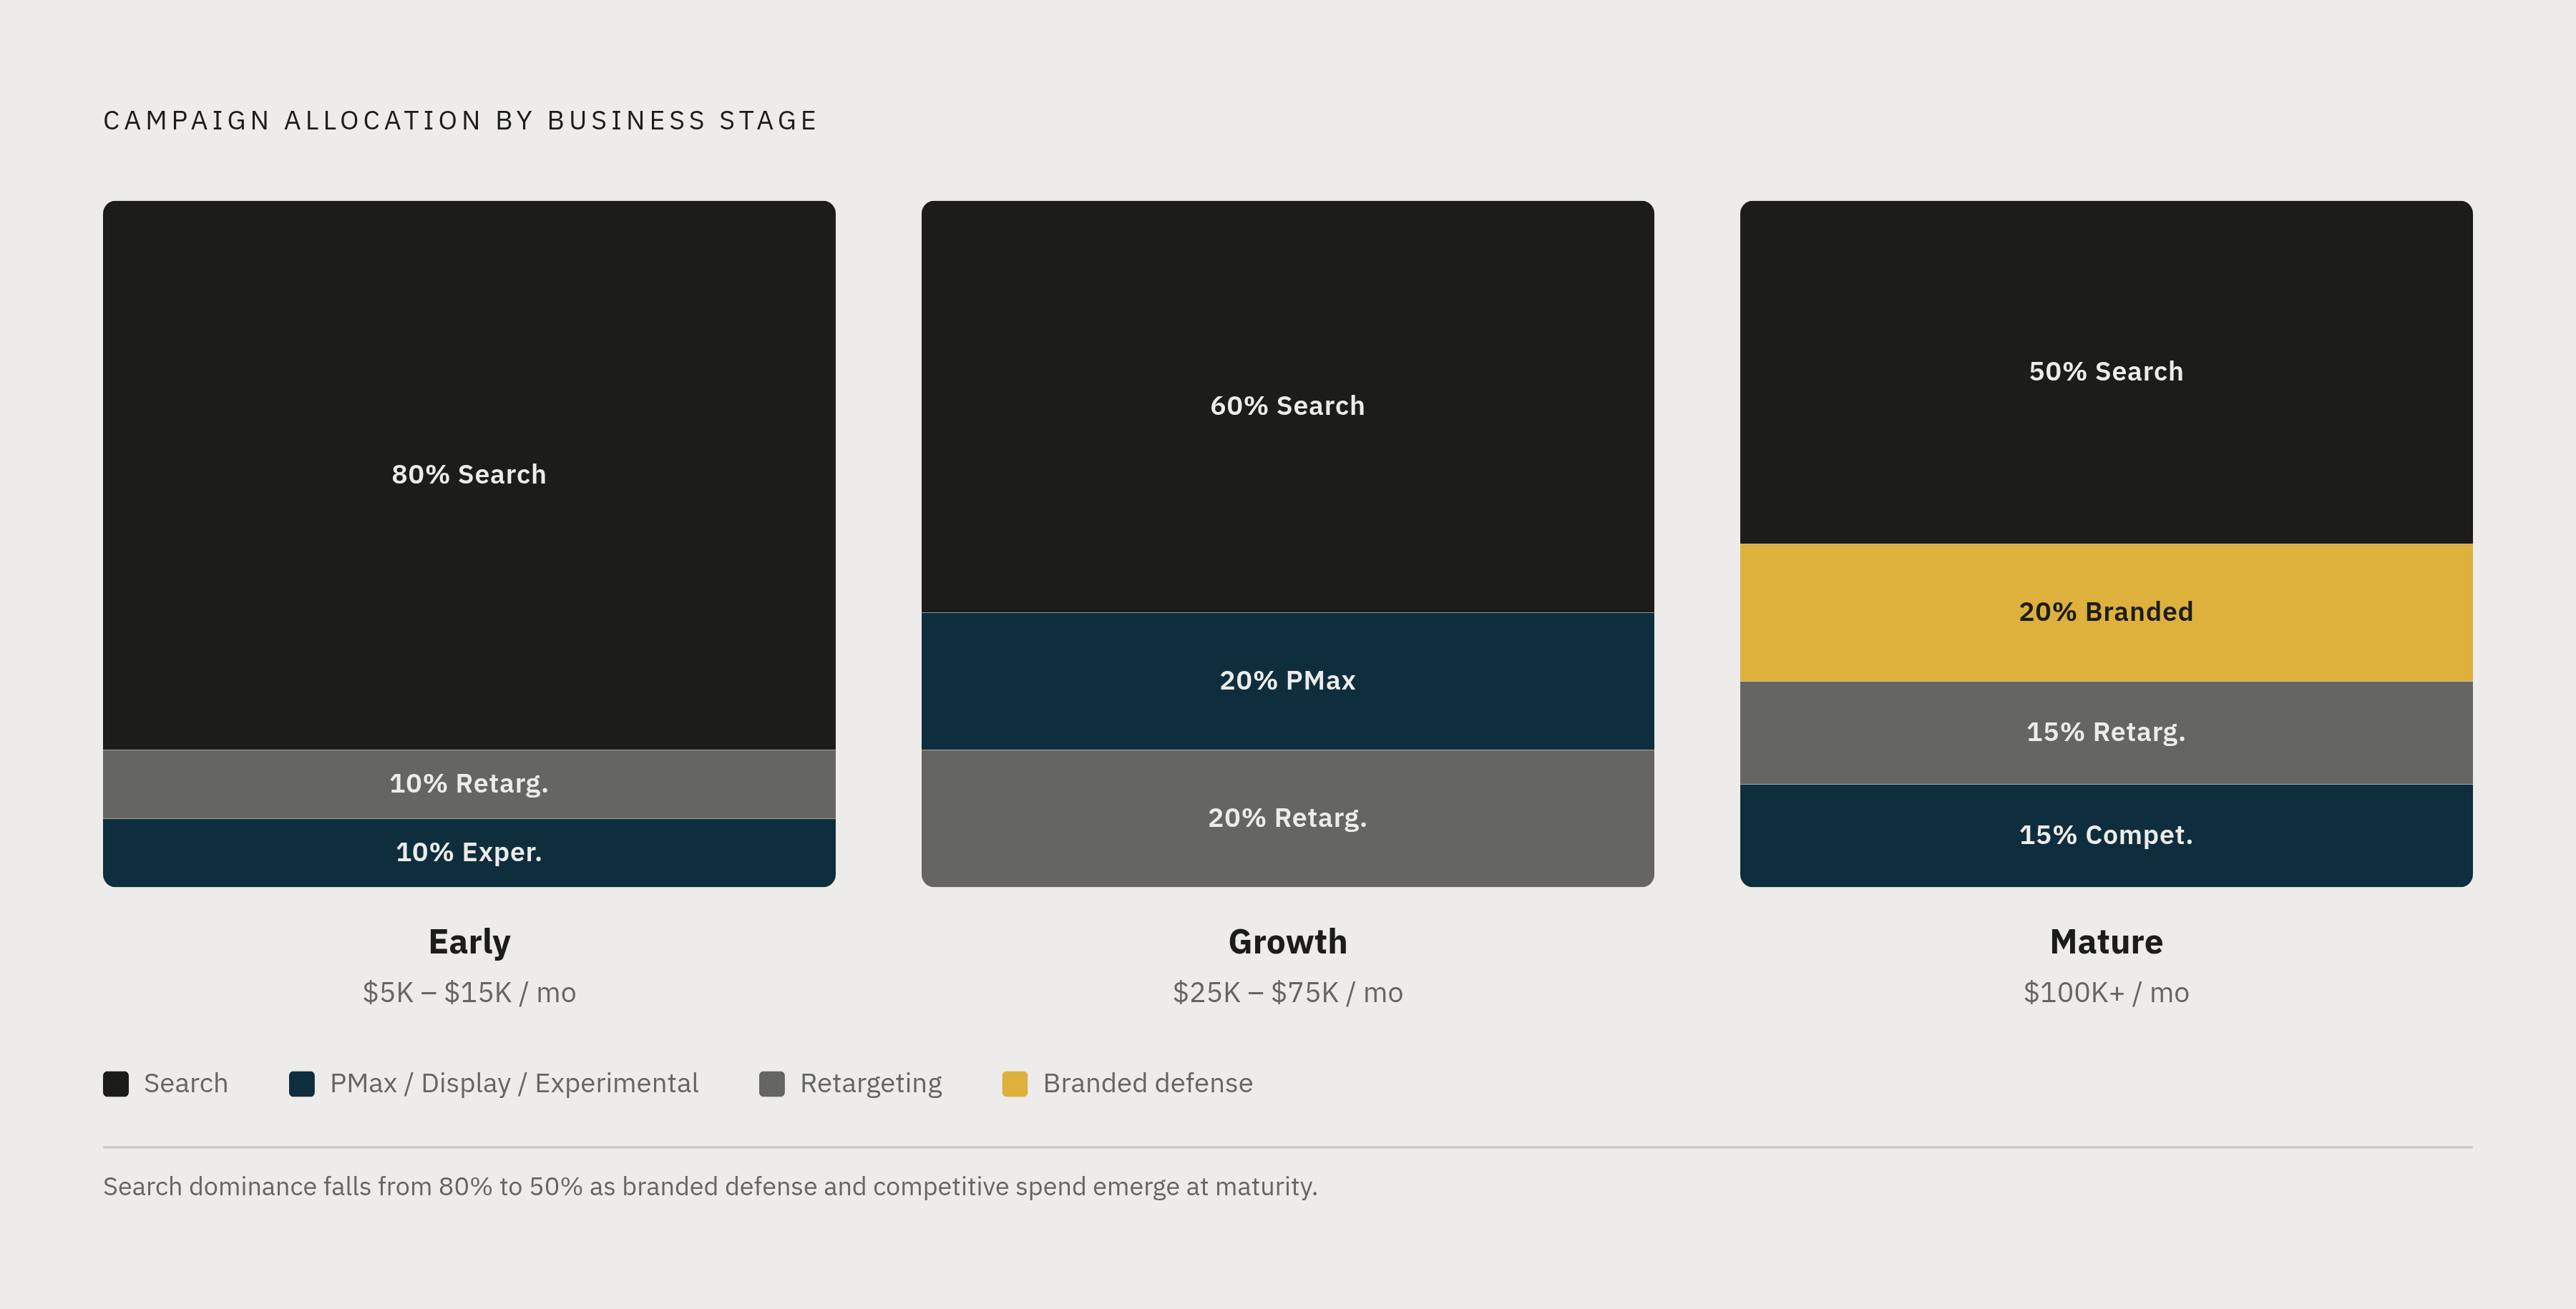
At early stage, the recommended campaign distribution is roughly 80% search, 10% retargeting, 10% experimental. Performance Max testing falls into that last bucket.
Why so heavy on search? Because search at this stage is the only campaign type with enough intent signal to tell you whether demand actually exists. Putting significant spend into Performance Max or display before the account has conversion data does not produce learning. It produces noise.
There is a practical budget floor to know about here. Around $3,000 to $5,000 per month per campaign is the minimum at which the algorithm can accumulate enough data to improve. Below that, accounts stall in a permanent learning phase. For context, seed-stage SaaS companies typically operate in the $5,000 to $15,000 monthly range in total. That is a narrow window, which makes every allocation decision matter more, not less.
What should you measure at this stage? Cost per MQL. MQL-to-SQL conversion rate. Which keyword clusters produce actual sales-qualified leads versus just form fills.
That last one is where early-stage teams get burned most often. Research suggests roughly 60 to 70% of form fills from Google Ads are unqualified. The problem is structural: if the only conversion event Google can observe is a form submission, it optimizes for form submissions. It does exactly what it was told. The algorithm is not broken. The instruction was wrong.
The fix is not tactical. It is architectural. Implement offline conversion import from the start. Tag leads with GCLIDs, push SQL status back to Google from your CRM, and give the algorithm the signal it actually needs to find buyers who move through the full pipeline. Companies doing this see 20 to 35% CPL reduction within 60 days. The improvement does not come from spending less. It comes from the algorithm finding better leads with the same spend.
One more early-stage trap worth flagging: the CPL math that teams consistently get wrong.
A $50 CPL converting to pipeline at 2% costs $2,500 per opportunity. A $200 CPL converting at 20% costs $1,000 per opportunity. The cheapest leads are often the most expensive pipeline. Put another way: chasing cheap leads is like buying discount fuel that stalls your engine halfway to the destination.
And while we are talking about structural foundations: negative keyword architecture is not optional. Most audited accounts have fewer than 50 negative keywords. One documented high-performing account credited an 814-keyword negative list as the single biggest driver of a 58x pipeline-to-spend ratio. That is not a rounding error. The account was not paying to be found by the wrong people, repeatedly.
Growth Stage: You Know What Works. Now Do Not Wreck It by Scaling Too Fast.
Growth-stage campaign distribution shifts to roughly 60% search, 20% Performance Max or display, 20% retargeting. But this distribution only makes sense if you have already done the early-stage work. The prerequisite is not optional: winning keywords identified, MQL-to-SQL rate understood, offline conversion data flowing back to Google.
Two concrete signals that tell you an account can absorb more spend productively:
- Stable or declining cost per SQL for four or more consecutive weeks. The algorithm has found a groove.
- SQL-to-opportunity conversion rate above 25%. Sales is confirming the leads are real.
Typical growth-stage monthly investment runs $25,000 to $75,000. At that level, the most common efficiency killer is account fragmentation.
The instinct when scaling is to create campaigns for every keyword variation and every audience segment. The result is dozens of campaigns, each with budgets too small for the algorithm to learn from. Google's automated bidding requires conversion volume to function. Target CPA, Max Conversions, Target ROAS — all of these starve when campaigns are fragmented. You end up with a lot of campaigns that are all in a permanent learning phase. None of them work the way they should.
It is also worth adjusting your expectations against current cost realities. CPCs rose 12.9% year-over-year in 2025. B2B and finance verticals average $17 or higher per click, according to Semrush's 2025 data. SaaS CPCs increased 29% year-over-year in 2026, reaching $8.86 on average. Growth-stage budget projections need to account for rising acquisition costs. Assuming 2023 benchmarks in a 2025 or 2026 market is a good way to blow past your targets without understanding why.
The HockeyStack 27-month study is worth confronting directly here. Average revenue ROI on Google Ads across that dataset was 1.31. Barely above breakeven. And ACV on closed-won deals from Google was declining over the period. The optimization gains from offline conversion import, tighter negative keyword architecture, and better landing pages are measured against that baseline. They are not bonuses on top of an already-efficient channel.
Mature Stage: The Goal Shifts From Building to Protecting
Mature-stage campaign distribution looks like this: roughly 50% search, 20% branded defense, 15% retargeting, 15% competitive campaigns.
The objective has changed. Competitors are bidding on branded terms. Category leaders are entrenching. The real risk is losing existing demand as much as failing to create new demand.
Branded search at this stage deserves its own moment. HockeyStack data shows branded Google Ads representing just 7% of total ad budget, with an average CPC of roughly €5.50, but delivering a ROAS of 1,299%. That figure looks absurd until you understand why it happens: lower cost, far fewer keyword varieties, and dramatically higher conversion probability. Branded searchers are already further down the funnel by definition. They are not discovering you. They are looking for you.
Non-branded search tells the opposite story. In the same HockeyStack dataset, non-branded Google Ads represent 39% of B2B ad budget but only 11.2% of traffic, with a ROAS of 78%. Below breakeven. At mature stage, non-branded spend is about maintaining category presence, not efficiency. You are paying to exist in the consideration set, not to generate a direct return on every dollar.
Typical mature-stage investment runs $100,000 or more per month. At that level, small inefficiencies represent significant absolute spend. Poor attribution and fragmented accounts stop being annoyances and start being expensive structural problems.
This is also where AI Overviews pressure is most acute for established players. High branded search volume means AI answers are increasingly intercepting the informational queries that previously drove top-of-funnel search traffic. The response is not to increase top-of-funnel search spend to compete with AI. It is to push more budget toward branded defense and mid-funnel retargeting, where you are talking to people who already know you exist.
Attribution Is Not a Nice-to-Have. It Is What Makes Any of This Work.
Every stage-based allocation described above assumes one thing is in place: proper attribution infrastructure. Without it, the framework breaks down entirely.
Here is the core problem. Google Ads optimizes toward whatever conversion event it can observe. If the only observable event is a form fill, it optimizes for form fills. Not SQLs. Not pipeline. Not revenue. Form fills. This is why 60 to 70% of form fills from Google Ads are unqualified. The algorithm is doing exactly what it was told.
The architectural fix is offline conversion import: tag leads with GCLIDs, push SQL status, opportunity stage, and closed-won data back to Google from your CRM. Now the algorithm has the signal it needs to find buyers who actually convert through the full pipeline. The documented impact is 20 to 35% CPL reduction within 60 days. Same spend, better leads.
What this means for the stage-based framework: without attribution in place, moving from an early-stage to a growth-stage campaign distribution (more Performance Max, more retargeting) accelerates spend against the wrong signal. You are scaling noise.
B2B sales cycles make this harder. Multi-touch, multi-month journeys mean a Google click that influenced a closed deal may be 90 to 180 days removed from the conversion event. Last-click attribution systematically undervalues upper-funnel and mid-funnel Google spend, which then leads to budget cuts against the campaigns that were actually doing meaningful work.
The executive metrics that attribution infrastructure needs to support:
- Cost per SQL. Not cost per lead.
- SQL-to-opportunity conversion rate by campaign type.
- CAC payback period.
- Pipeline influenced versus pipeline sourced.
Without those outputs, budget allocation decisions default to vanity metrics. Impressions. Clicks. MQLs. None of those tell a revenue leader whether Google Ads is earning its place in the portfolio.
The Signals That Tell You to Move Budget, Hold It, or Reallocate It
The budget conversation is not annual. B2B Google Ads performance shifts as competition moves, CPCs rise, and algorithm behavior evolves. You need review triggers, not just annual planning cycles.
Green signals. The account can absorb more spend productively:
- Stable or declining cost per SQL for four or more consecutive weeks.
- SQL-to-opportunity conversion rate above 25%.
- LTV:CAC at or above 3:1. The minimum threshold for sustainable growth.
- Conversion volume per campaign approaching 30 per 7 days. Smart Bidding can function properly at that level.
Hold signals. Adding budget will not improve outcomes:
- Account still in learning phase with insufficient conversion data per campaign.
- MQL-to-SQL rate declining. In the HockeyStack 27-month data, the average from Google Ads was 19.53%. A declining rate means lead quality is eroding, not that you need more volume.
- No offline conversion import in place. Adding budget here optimizes against form fills, not pipeline.
Reallocation signals. The mix is wrong, not the total:
- Branded campaigns consuming less than 7% of budget while competitors are visibly bidding on brand terms.
- Non-branded search absorbing high budget share with sub-80% ROAS and no mid-funnel support to justify the category presence cost.
- Top-of-funnel informational queries increasingly intercepted by AI Overviews. The move is toward higher-intent queries and retargeting, not defending real estate that AI is claiming.
The reallocation that gets skipped most often: negative keyword investment. An account with fewer than 50 negative keywords is systematically paying for irrelevant traffic regardless of how well the campaign-type distribution looks on paper. Fixing the distribution without fixing the negative keyword architecture is rearranging the furniture while the window is still open.
The discipline that ties all of this together is a weekly review cadence tied to pipeline outcomes, not click reports. Allocation decisions should be made against actual revenue signals. Not trailing platform metrics that look fine while the pipeline is quietly eroding.
The budget question in B2B Google Ads is not arithmetic. It is strategic. What stage are you in? What does the algorithm need to learn? What does your attribution infrastructure actually support? Answer those questions first. The number follows from them. For sales-led B2B teams without an in-house owner to run that discipline, Thunder, an applied-AI company whose agents execute Google and LinkedIn Ads end to end while a Forward Deployed Marketer holds accountability for outcomes, is built around exactly this delegation model.